Compare Current vs Future Business States
Product Description
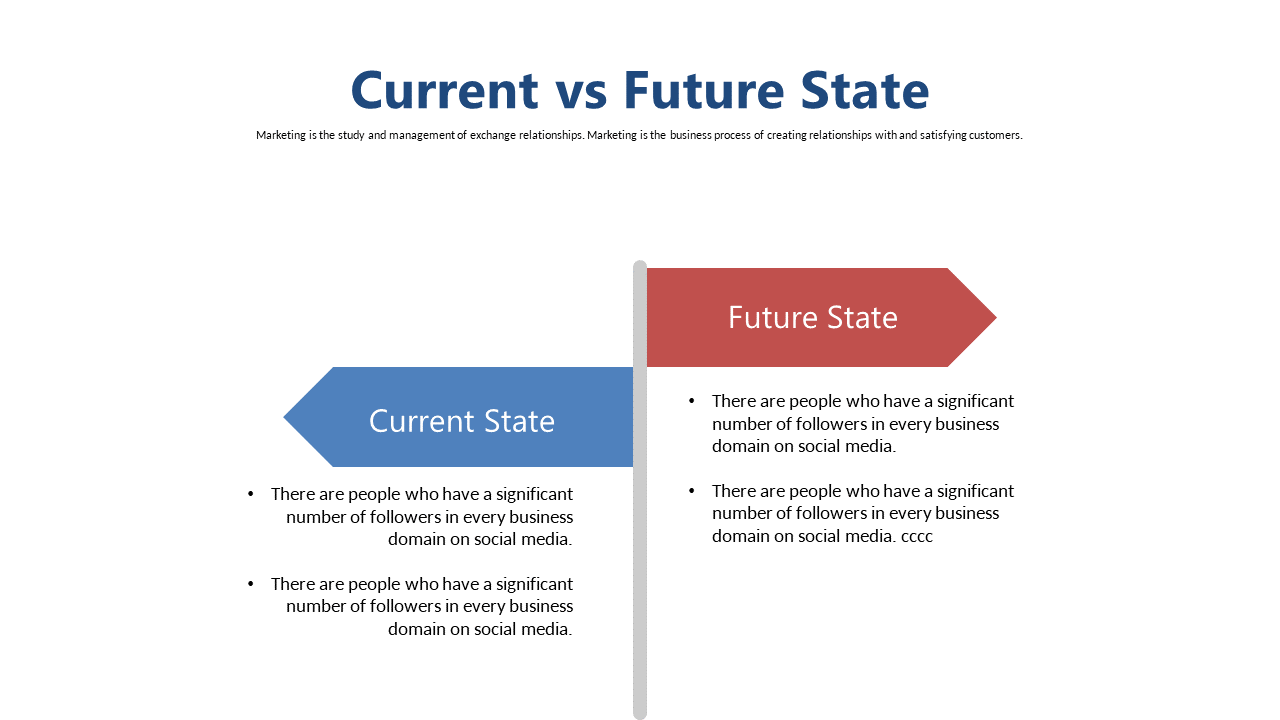
Shifting from the current to a future business state can be hard to articulate, especially under time constraints. This slide simplifies that process by allowing you to visually compare what exists today with where you aim to be tomorrow, making the changes clear and digestible.
Business strategists, change management professionals, and team leaders can use it during presentations to the board or all-hands meetings, highlighting how proposed strategies will lead the organization forward. This slide helps you break down complex transitions into understandable visuals, making it easier for everyone to grasp the big picture.
For only $0.99, you can download this slide instantly, ready to customize in PowerPoint or Google Slides. Editing is straightforward, letting you focus on your message while being presentation-ready in minutes.
$0.99 – Purchase Checkout
Added to cart







