Engaging Current vs Future State Comparison Diagram
Product Description
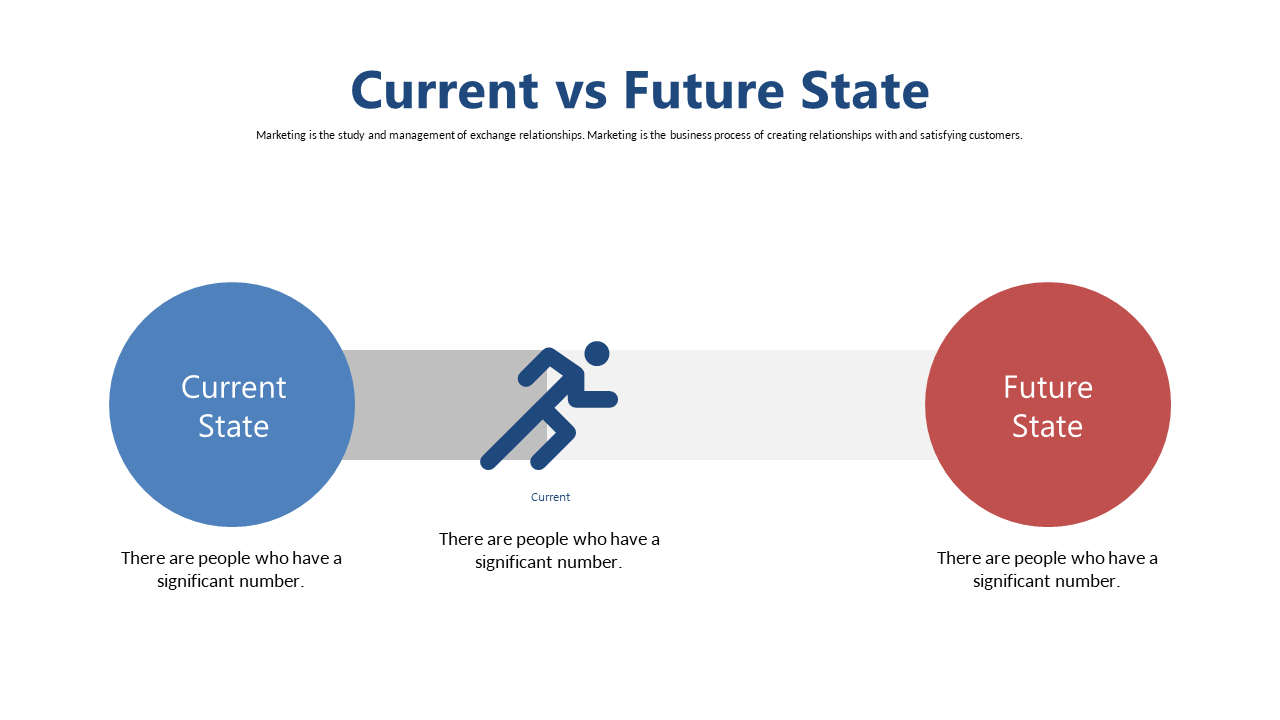
Presenting intricate changes in business processes can often lead to confusion. This Engaging Current vs Future State Comparison Diagram cuts through the noise, allowing you to clearly showcase differences in a visually appealing way that captures your audience’s attention.
Marketing managers, operations directors, and business analysts can utilize this slide for stakeholder meetings and strategic updates, where clarity is crucial. Whether you’re demonstrating how a new initiative will impact customer engagement or workflow efficiency, this slide helps make those comparisons simple and effective.
At just $0.99, this slide is available for instant download and is easily editable in both PowerPoint and Google Slides. You can quickly customize it to fit your narrative and get ready to impress your audience in no time.
$0.99 – Purchase Checkout
Added to cart