Side-by-Side Comparison of Current vs Future States
Product Description
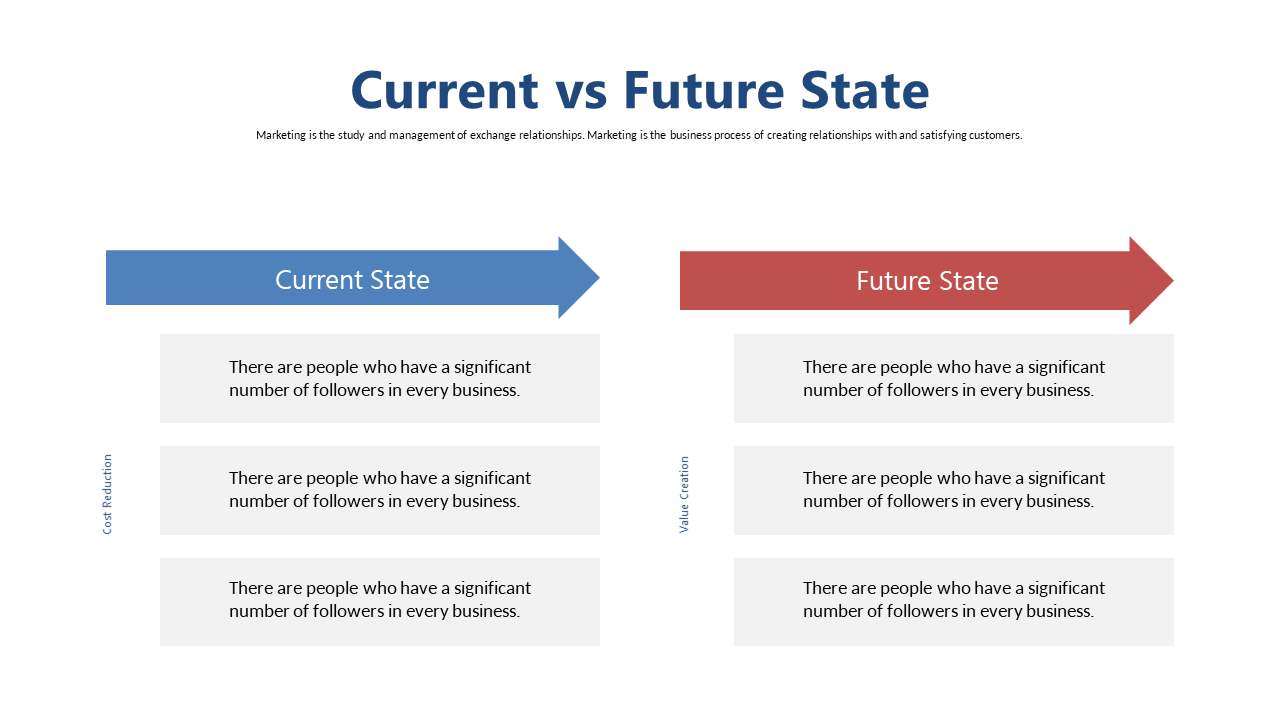
When you need to explain how a client’s situation will evolve, visual clarity is essential to getting your point across. This side-by-side comparison slide effectively presents the current and future states, allowing you to highlight key insights that drive home your message.
Consultants advising clients, project managers outlining changes for teams, or business analysts preparing reports will find this slide extremely useful. It’s versatile enough for strategic discussions, proposal meetings, or any situation where you need to illustrate transformations clearly.
At just $0.99, you can easily download this slide and modify it in PowerPoint or Google Slides to meet your needs. With its straightforward design, you can quickly adjust the content to reflect your specific insights and make a strong impression.
$0.99 – Purchase Checkout
Added to cart







