Explore Current vs Future State with Steps
Product Description
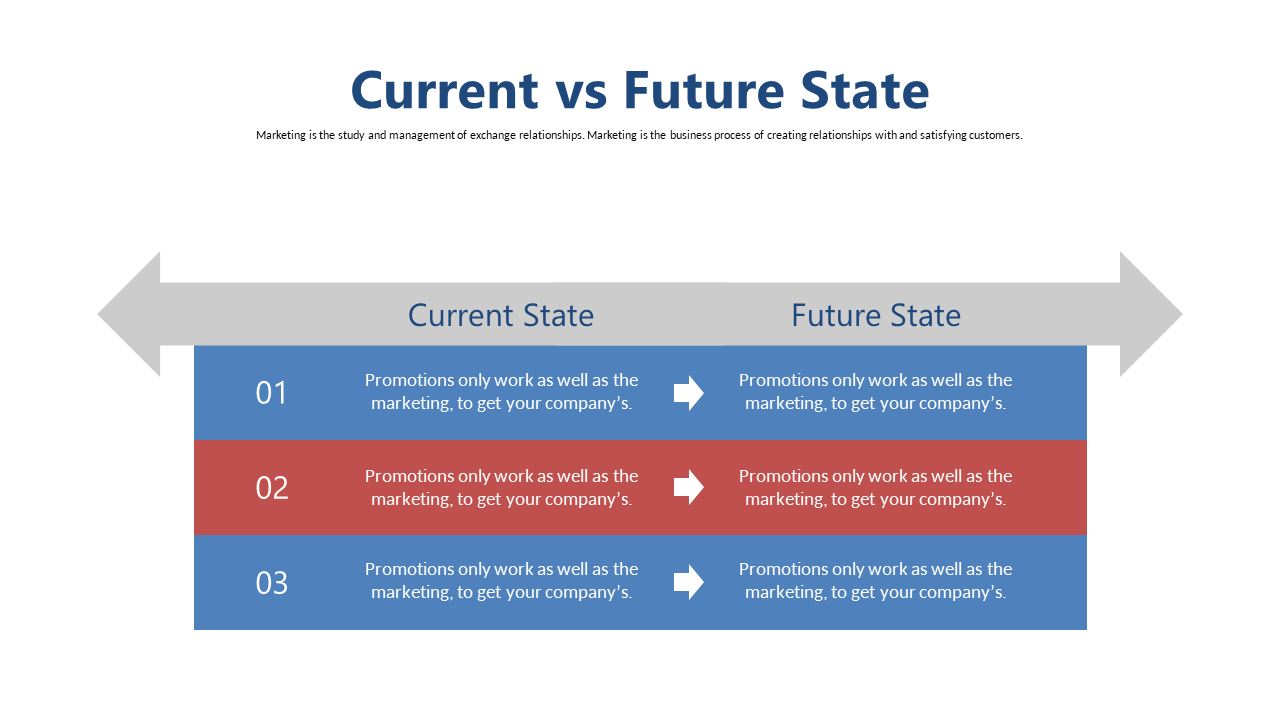
When you’re trying to show potential growth opportunities to your audience, illustrating the shift from a current to a future state can be challenging. You need to clearly outline the steps your organization can take to achieve its goals, making the vision tangible and relatable for your audience.
This slide makes that comparison straightforward and engaging. This slide is perfect for sales managers presenting to potential clients, project leads looking to convey strategic growth, or consultants pitching innovative solutions. Whether you’re discussing a new product launch in a board meeting or reviewing sales strategies in a team huddle, this visual tool will help you communicate effectively.
At just $0.99, you can download this slide and customize it in PowerPoint or Google Slides in no time. It’s designed for easy editing, so you can tailor the content to fit your specific needs and make your presentation shine almost instantly.
$0.99 – Purchase Checkout
Added to cart







