Evaluate Strategies with Matrix Comparison V2
Product Description
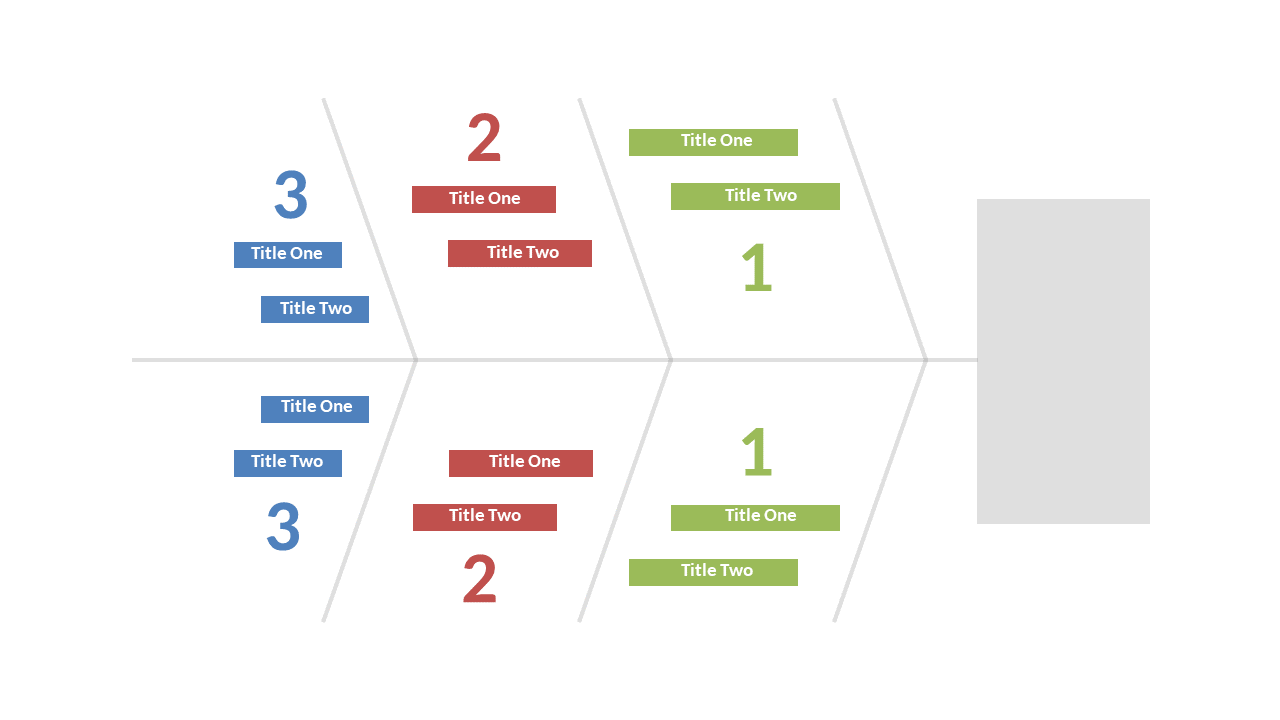
As an analyst, it can be challenging to present multiple strategies in a way that keeps everyone engaged and informed. This matrix comparison slide simplifies that process, using a clear format to differentiate various elements, making it easy for your audience to follow along.
You can visually categorize options to help highlight what’s important. Consultants, data analysts, and project managers can utilize this slide during strategy sessions or performance reviews. It’s perfect for outlining potential courses of action in team meetings or for showcasing market analysis data to clients.
Available for just $0.99, this slide is ready for instant download and easy to customize in PowerPoint or Google Slides. You’ll be able to present your evaluations quickly and effectively in no time.
$0.99 – Purchase Checkout
Added to cart







