Engage with Three-Point Comparison Layout
Product Description
Making clear comparisons is crucial in sales, and without the right visuals, your message may get lost. You need a way to quickly showcase options that resonate with your audience, making decisions easier.
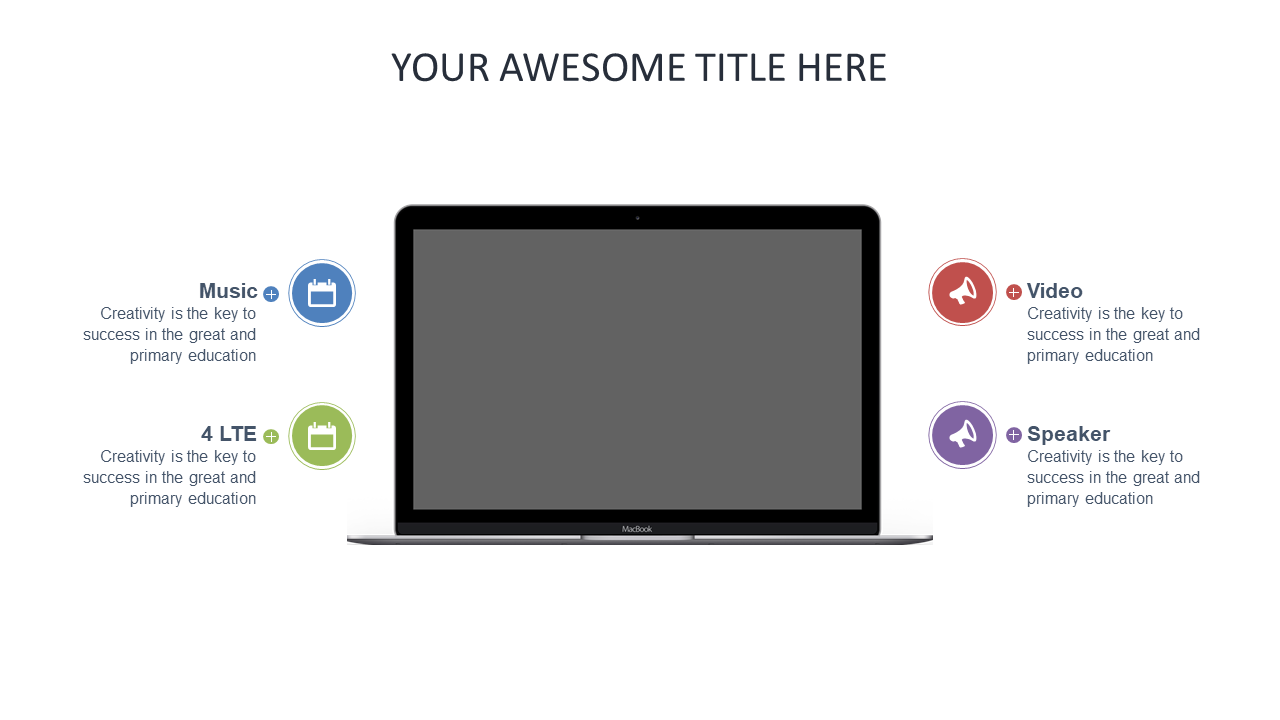
This slide features a three-point comparison layout that makes it simple to highlight critical differences in products or services. Sales reps, account managers, or product specialists can benefit from this layout during pitch meetings, product demos, or webinars. Whether you’re discussing software features with potential clients or comparing offerings in a competitive analysis, this slide will help convey your points effectively.
Available for just $0.99, you can download this slide instantly, and it’s fully editable in PowerPoint or Google Slides. Simplify your comparisons and enhance your presentations today!
$0.99 – Purchase Checkout
Added to cart







