Compare Usability and Design Metrics in PowerPoint
Product Description
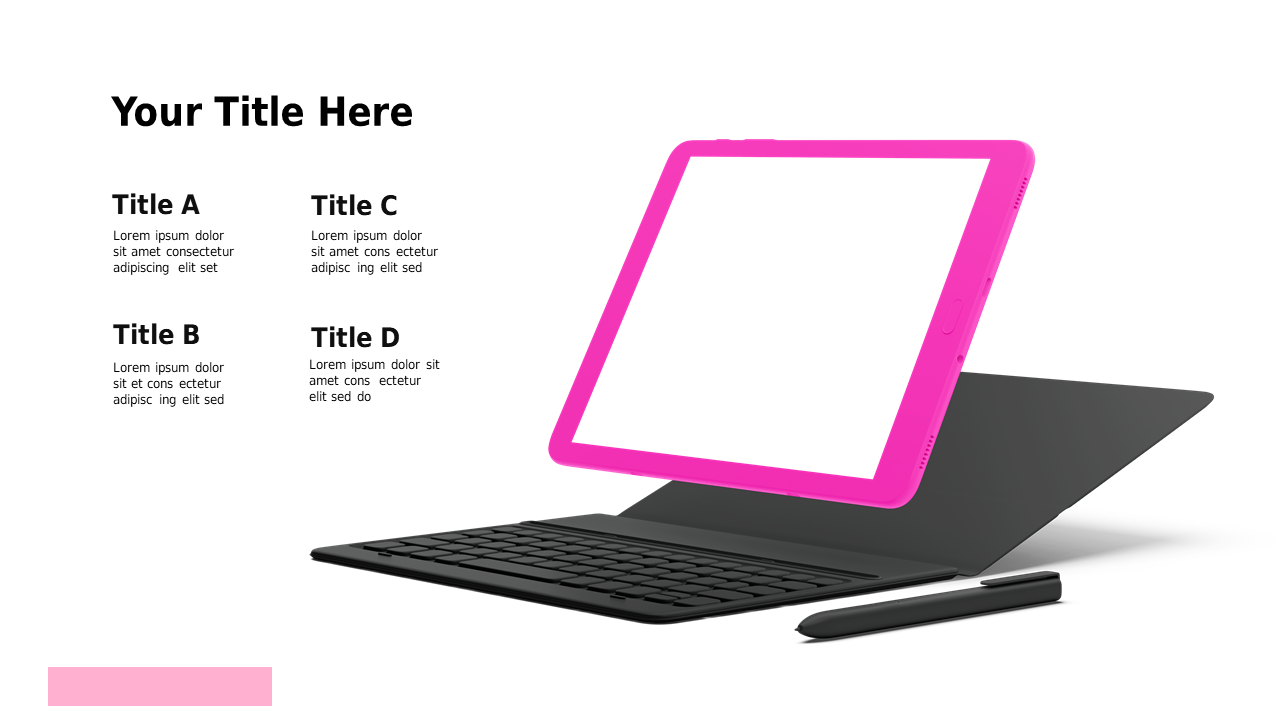
Translating complex usability and design metrics into clear comparisons can feel like a daunting task for strategy managers. This slide simplifies that process with a visually appealing layout on a tablet mockup, making it easy for your audience to grasp the key differences in percentages.
You’ll find this slide incredibly useful during tech presentations or strategy meetings when you need to discuss product effectiveness. It allows you to showcase the balance between usability and design, helping your colleagues and clients understand your insights quickly.
For a low price of $0.99, you can download this slide right away and begin editing it in PowerPoint or Google Slides. Customize it to seamlessly fit your presentation needs in just a few moments.
$0.99 – Purchase Checkout
Added to cart







