Usability vs. Design Metrics Comparison V4
Product Description
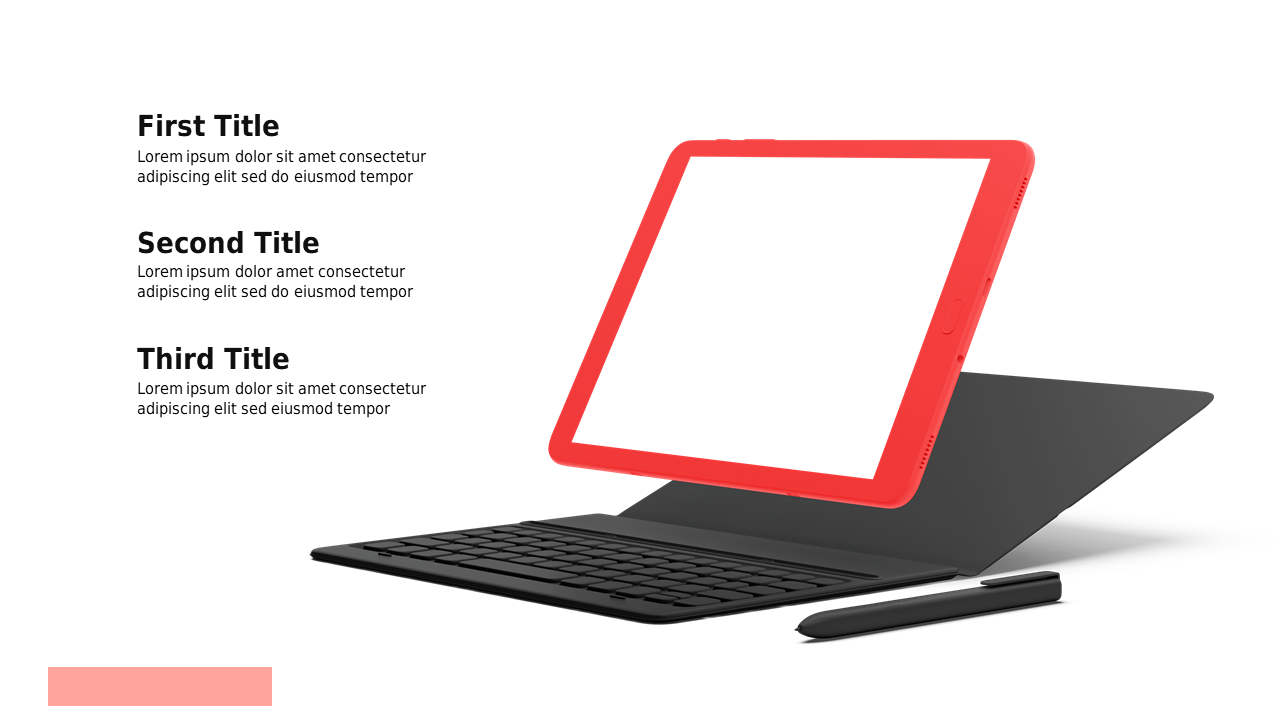
Balancing usability and design metrics is essential for effective communication, but presenting them can be tricky. This slide makes it easy to visualize those differences with a sleek tablet mockup, allowing your audience to see critical comparisons at a glance.
Sales leads and project managers can benefit greatly from this slide when preparing pitches or status updates. It helps you demonstrate the impact of usability on design choices during discussions, ensuring clarity and understanding among your team and clients.
For only $0.99, this slide is available for instant download and can be customized quickly in PowerPoint or Google Slides. You’ll be ready to present your information effectively in just minutes.
$0.99 – Purchase Checkout
Added to cart







