Usability vs. Design Metrics Comparison V3
Product Description
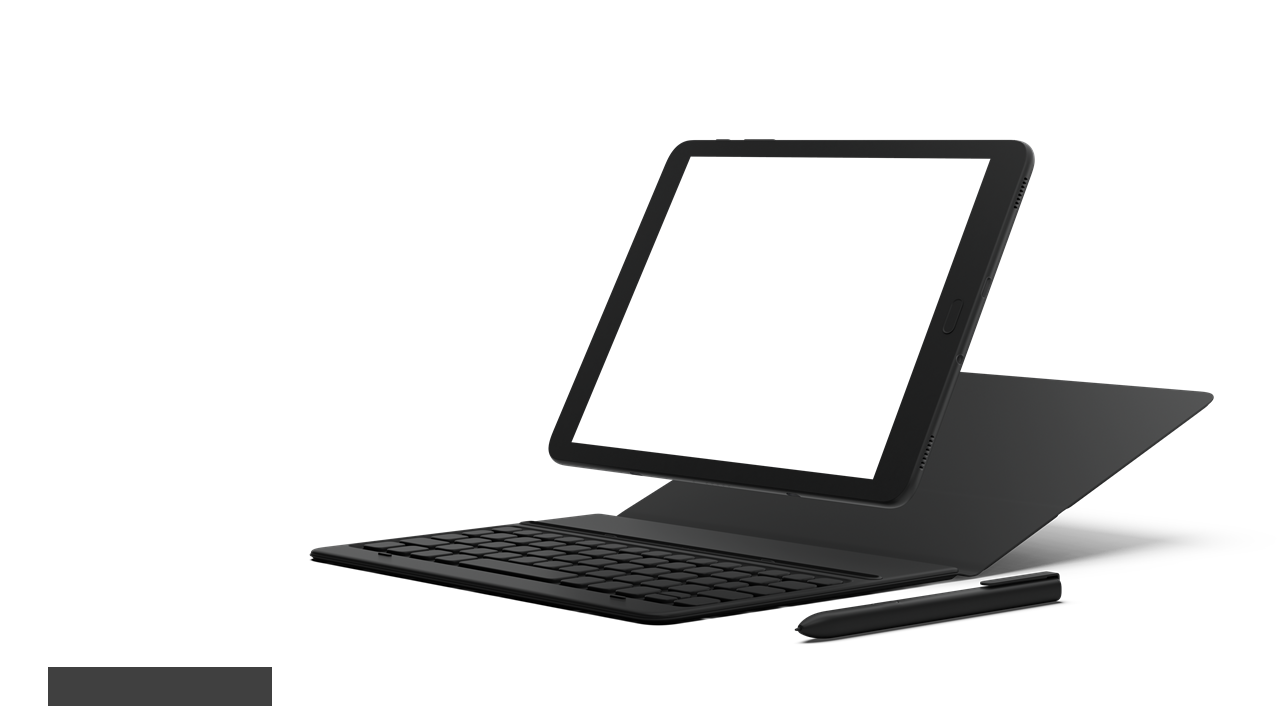
When you’re faced with the challenge of simplifying complex information about usability and design metrics for clients, it can be tough to find the right approach. This slide provides a clean presentation format that highlights key percentages on a tablet mockup, making it simple for your audience to follow along and understand the core differences.
This slide is an excellent choice for consultants and marketing specialists during client presentations or project kick-offs. You can clearly communicate your analysis of usability versus design metrics, making it easier for your clients to make informed decisions about their projects.
At just $0.99, you can download this slide immediately and edit it to suit your style in PowerPoint or Google Slides. Get ready to enhance your presentations in no time.
$0.99 – Purchase Checkout
Added to cart







