Usability vs. Design Metrics Comparison V2
Product Description
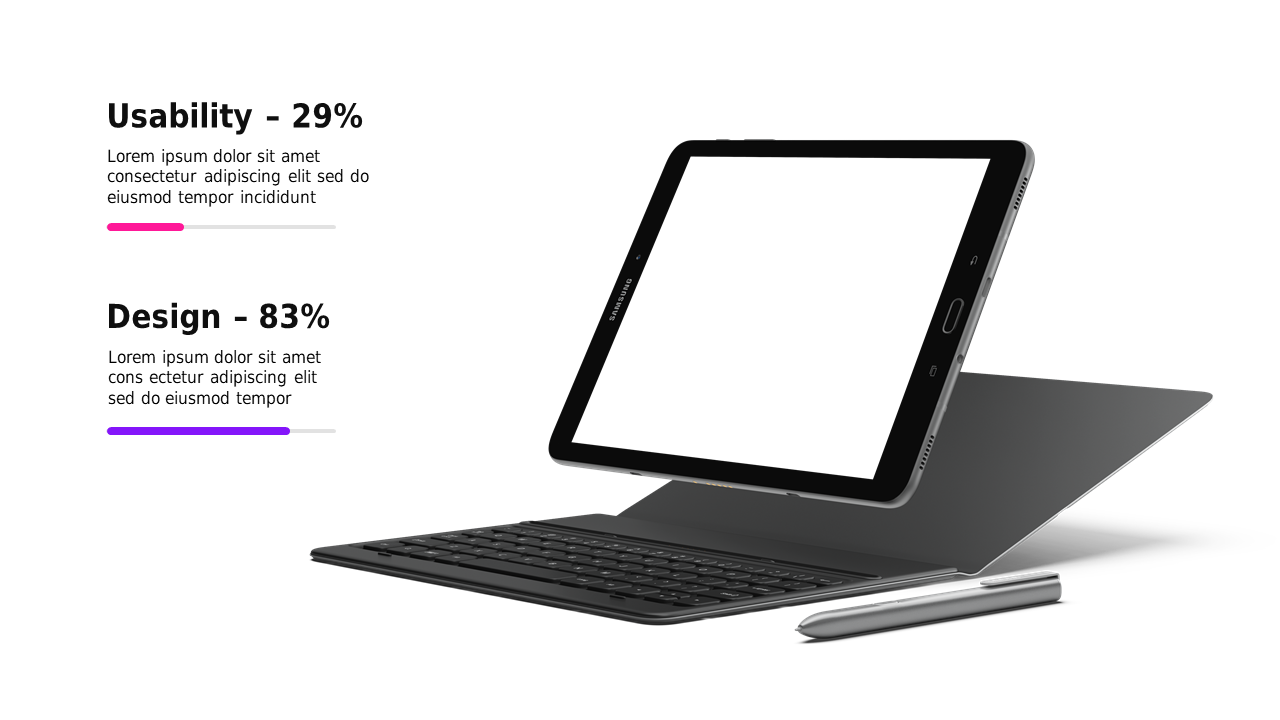
Conveying the differences between usability and design can feel overwhelming, especially when you want to make sure your audience understands the key distinctions. This slide gives you a crisp, engaging way to illustrate the metrics side by side on a sleek tablet mockup, making it easier for everyone to grasp critical points quickly.
This slide is perfect for user experience researchers and product designers when presenting findings at team meetings or design reviews. It helps you articulate the balance of metrics during brainstorming sessions, ensuring everyone is on the same page as you analyze user feedback versus design choices.
For just $0.99, this slide is ready for instant download, allowing you to edit it easily in both PowerPoint and Google Slides. You’ll be able to customize it to fit your specific needs in minutes.
$0.99 – Purchase Checkout
Added to cart







