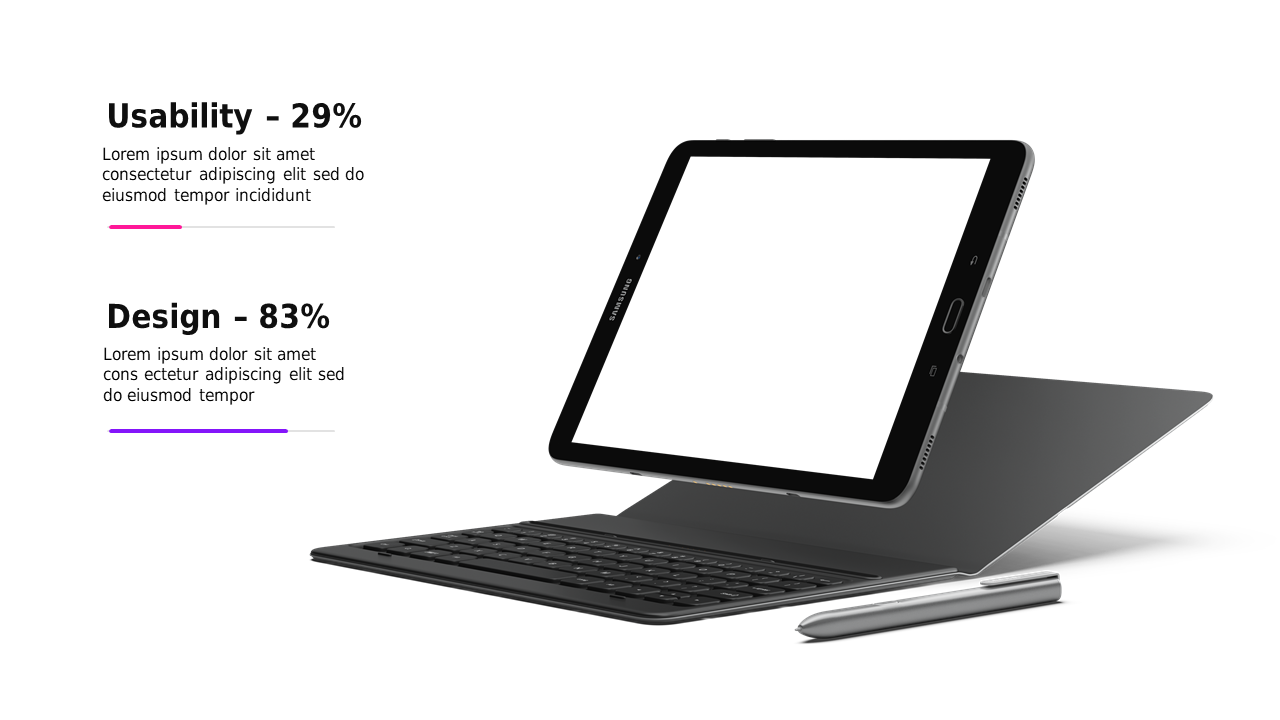
Usability vs. Design Metrics with Tablet Mockup
Product Description
As a strategy manager, you’re often tasked with presenting complex metrics that inform critical decisions. It can be challenging to convey usability and design differences in a clear way.
This usability versus design metrics slide with a tablet mockup allows you to present information side by side, making comparisons straightforward and visual. This slide is ideal for UX designers evaluating product performance, product managers discussing user feedback, or marketing teams analyzing customer satisfaction. Whether you’re in a strategy meeting, a client review, or a brainstorming session, this visual aid helps clarify essential data points that drive informed decision-making.
For just $0.99, you can download this slide right now and edit it effortlessly in both PowerPoint and Google Slides. With it ready in minutes, you can concentrate on crafting your insights instead of worrying about presentation design.
$0.99 – Purchase Checkout
Added to cart







