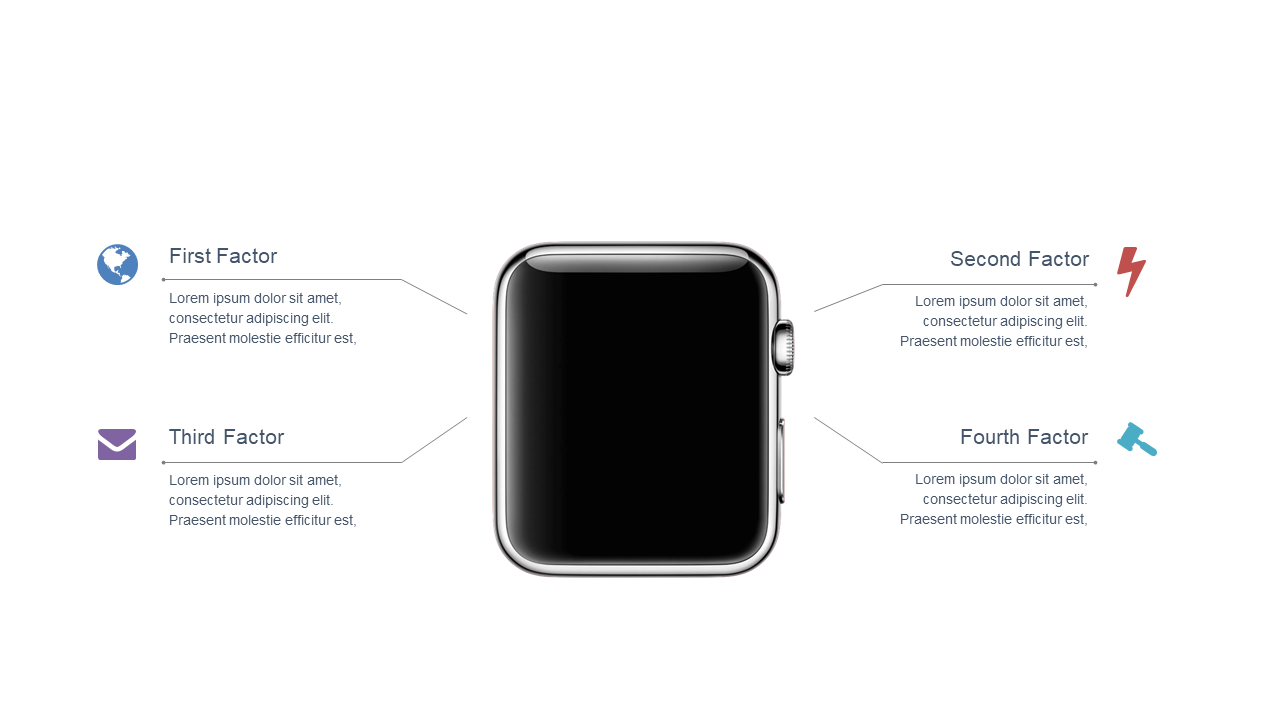
Central Image Comparison for Key Factors
Product Description
During critical meetings or client pitches, presenting complex comparisons in a straightforward manner is essential. You want to ensure your audience understands key factors without getting lost in the details.
This central image comparison slide simplifies that process, allowing you to display vital information in an engaging and easily digestible format. This slide is perfect for financial analysts comparing investment options, product managers highlighting feature advantages, or business consultants presenting strategic insights. Use it in client proposals, team discussions, or board meetings to keep everyone aligned and informed about key takeaways.
Available for just $0.99, you can download this slide instantly and customize it in PowerPoint or Google Slides. It’s designed for quick edits, so you can focus more on your content and less on the logistics of presentation design.
$0.99 – Purchase Checkout
Added to cart







