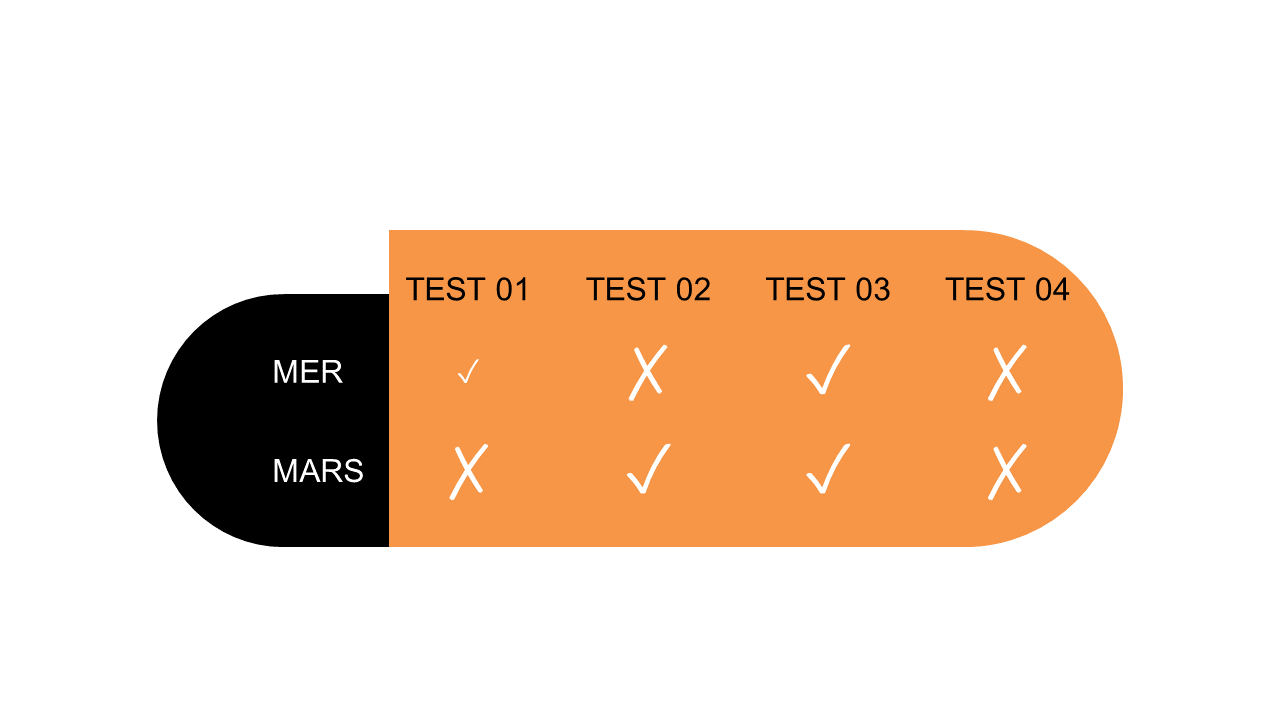
Test Results Comparison Box for Clear Presentation
Product Description
Communicating test results can feel overwhelming, especially when the data is complex or needs a side-by-side comparison. You want your audience to grasp the differences at a glance, but without the right tools, those insights can get lost in translation.
This slide offers a straightforward comparison box that highlights test outcomes clearly, ensuring your key messages get through. This is perfect for data analysts looking to present research findings, quality assurance teams comparing product test results, or educators sharing assessment outcomes with students and parents. If you’re working in pharmaceutical companies, tech firms, or academic settings, this slide will help you present your data in a way that everyone can understand, making your meetings more effective.
Available for just $0.99, this slide is ready for instant download and easy to edit in both PowerPoint and Google Slides. You’ll have everything you need to create your presentation in minutes, making it a no-brainer for your next briefing or report.
$0.99 – Purchase Checkout
Added to cart







