Version 2: Icon-Based Horizontal Timeline for Milestones
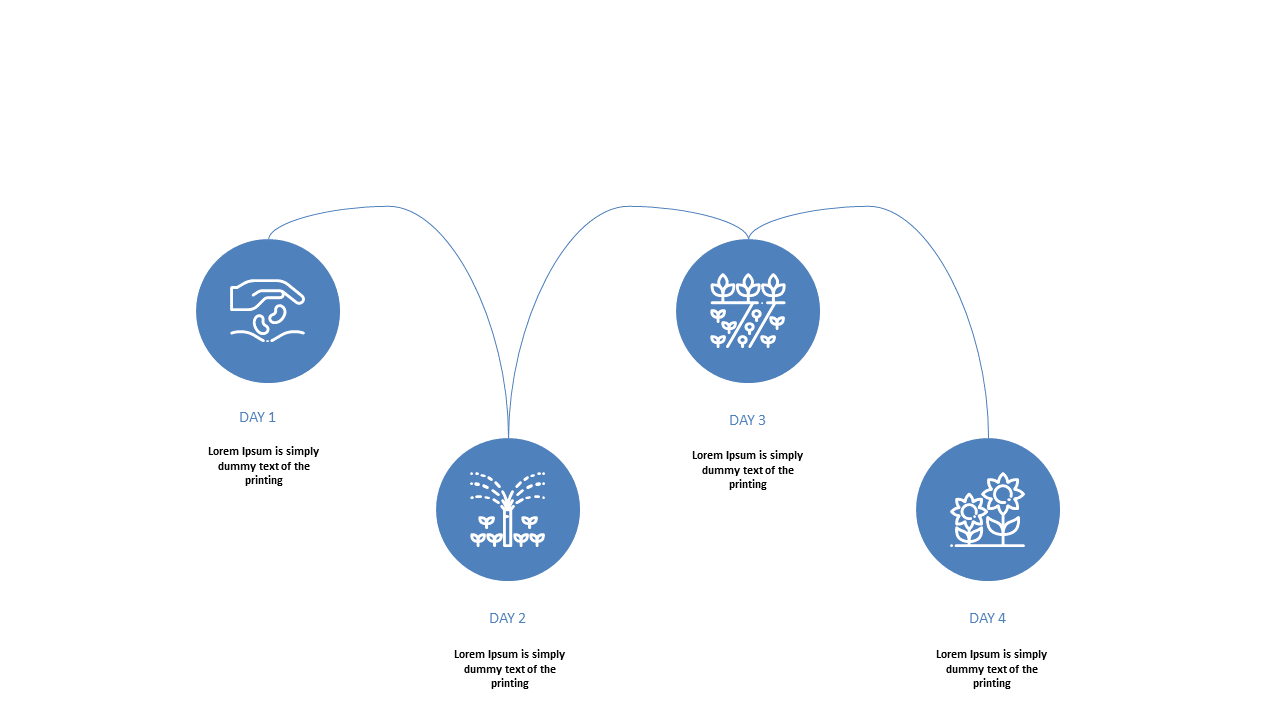
Product Description
Juggling multiple projects can lead to confusion, especially when it comes to keeping track of key milestones. You need a clear and concise way to present your timeline that won’t overwhelm your audience while still highlighting important events.
With this icon-based horizontal timeline, you can easily show your project’s progression in a visually appealing format. This slide is perfect for project managers, product leads, or team coordinators who need to communicate project updates during status meetings or stakeholder presentations. Whether you’re in tech, education, or marketing, this timeline will help you effectively illustrate your project’s critical junctures in a way that resonates with your audience.
For just $0.99, you get an instant download that’s fully editable in PowerPoint and Google Slides. Customize it to fit your needs within minutes and make it your own!
$0.99 – Purchase Checkout
Added to cart