Compare Projects with Venn Diagram Layout
Product Description
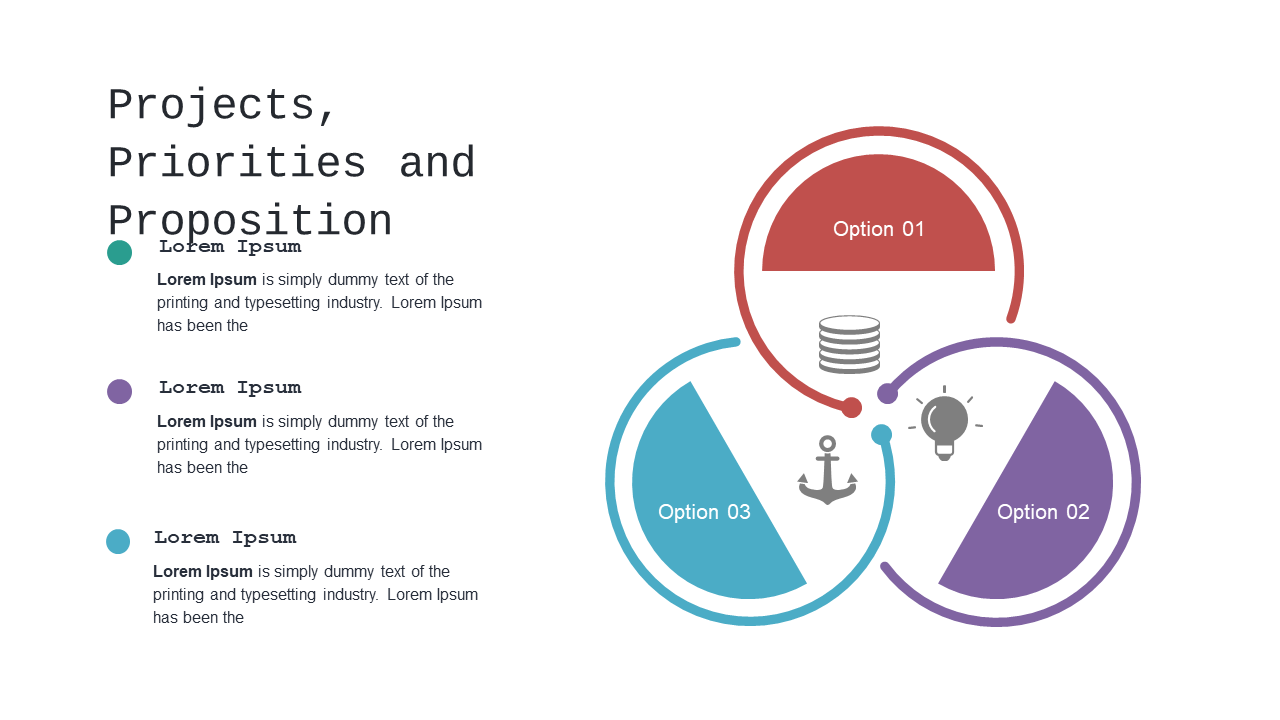
When managing multiple projects, distinguishing their similarities and differences can be a real challenge. The Venn diagram layout allows you to visually compare and contrast three distinct options, making decision-making clearer and more straightforward for your audience.
This slide is ideal for project managers weighing project proposals, product teams evaluating features, or consultants presenting options to clients. Its clear design can enhance discussions in board meetings, strategy sessions, or team collaborations across a variety of sectors.
For only $0.99, you can download this slide instantly and customize it in PowerPoint or Google Slides. Editing is simple and quick, providing you with a ready-to-use comparison tool that will capture attention in no time.
$0.99 – Purchase Checkout
Added to cart







