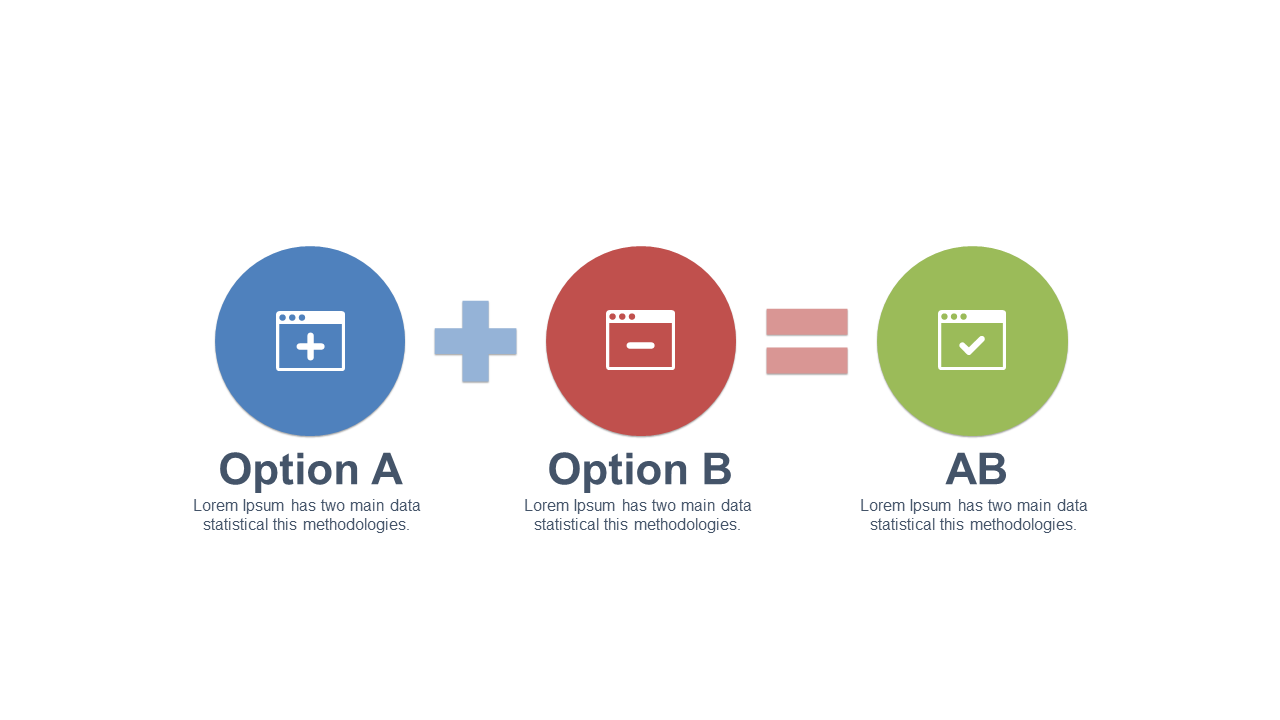
Compare Options A and B with Results
Product Description
Navigating complex decisions can be challenging, particularly when you need to present various options clearly. This slide simplifies that process, allowing you to create a clear and engaging side-by-side comparison of Options A and B, helping your audience make informed choices.
This slide is particularly useful for sales leads, business analysts, or product managers who need to present comparisons during client meetings, strategic discussions, or product launch presentations. It visually delineates options, making decision-making easier for everyone involved.
Offered at just $0.99, you can download this slide instantly and edit it in PowerPoint or Google Slides. It’s designed for quick modifications, providing you with a polished presentation in just a few minutes.
$0.99 – Purchase Checkout
Added to cart







