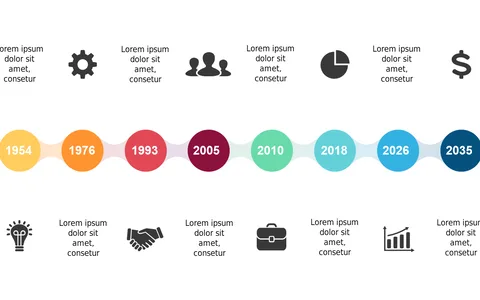
Showcase Project Progress with Horizontal Timeline V2

Product Description
Communicating project progress clearly is essential, but it’s often difficult to do so in a straightforward manner. This slide offers a simple yet effective horizontal timeline to illustrate key milestones, helping your audience grasp the current status at a glance.
Operations managers, team coordinators, and business analysts can utilize this slide in various scenarios, such as project reviews, strategic planning meetings, or progress reports. It’s perfect for quickly updating stakeholders or team members on where a project stands, enhancing clarity and focus.
You can download this slide for just $0.99 and make it your own in PowerPoint or Google Slides. Editing is quick and easy, so you can concentrate on conveying your message and keeping everyone on track.
$0.99 – Purchase Checkout
Added to cart