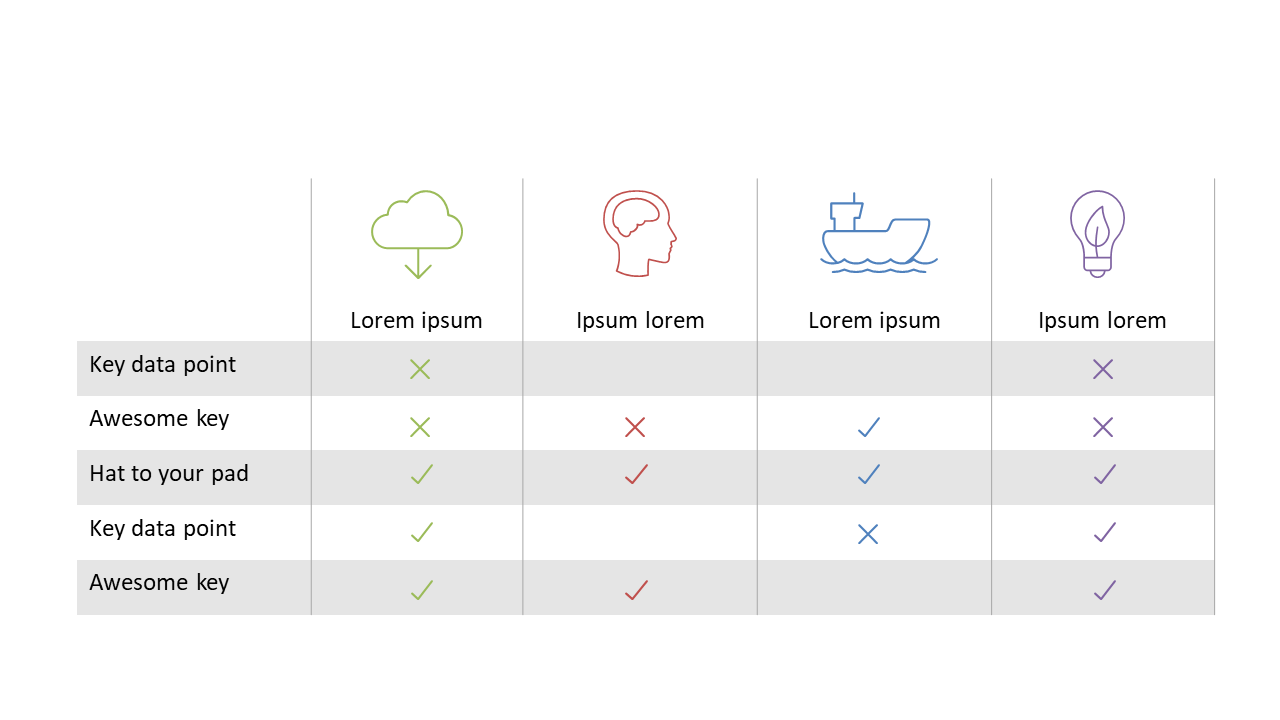
Comparison Table with Icons for Visual Clarity
Product Description
When you’re trying to convey differences between options, a cluttered slide can lead to confusion and disengagement. It’s critical to present information in a way that’s easy to digest, and this comparison table with icons does just that.
By simplifying the information visually, you help your audience understand key distinctions in a matter of seconds. This slide works wonders for product managers evaluating software features, marketers comparing campaign choices, or procurement teams assessing vendor offerings. No matter the industry, you’ll find this slide fits perfectly into your presentations during decision-making meetings or strategic planning sessions.
At just $0.99, this slide is a steal. Download it today and edit it effortlessly in PowerPoint or Google Slides to tailor it to your needs in no time at all.
$0.99 – Purchase Checkout
Added to cart







