Compare Brand Features with Editable Table
Product Description
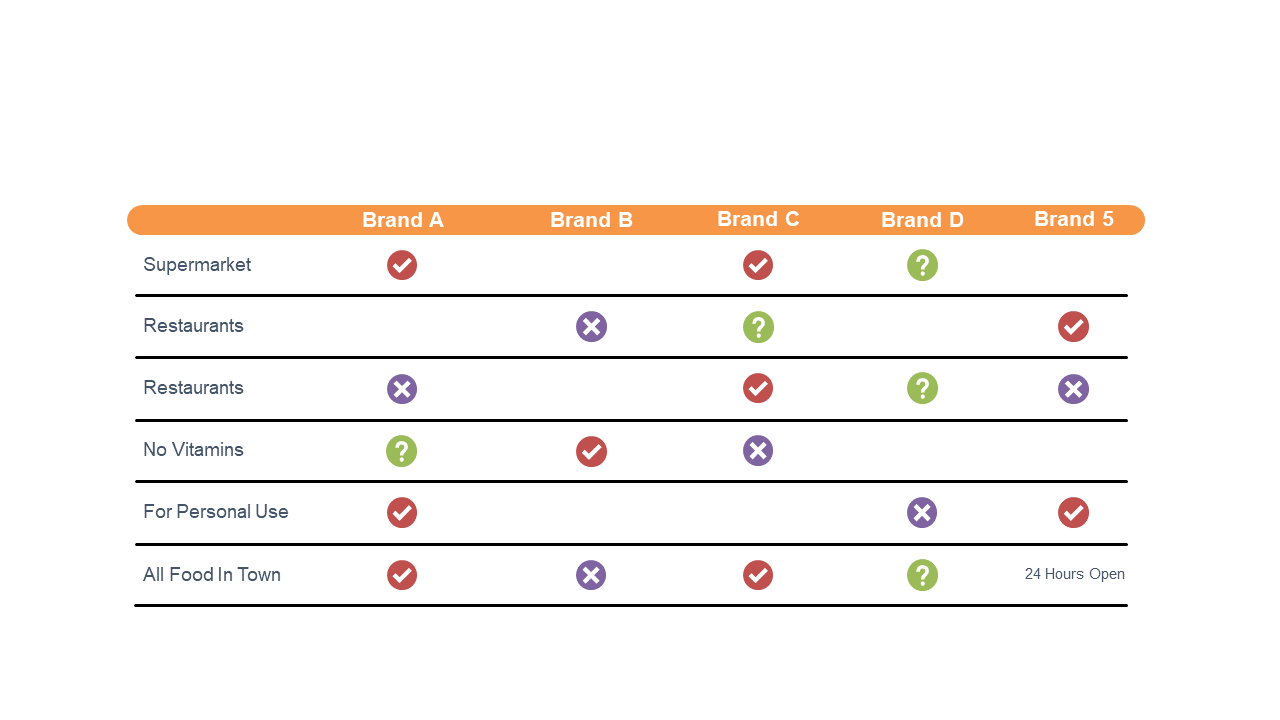
In a market flooded with options, comparing brand features can be an uphill battle. You need to present your findings clearly to ensure everyone understands the differences without getting lost in the details. This editable comparison table simplifies that process, giving you a clean format to highlight key criteria side by side.
Think about a sales manager preparing for a pitch or a product analyst compiling research for a presentation. This slide is great for team discussions on brand strategy or when you’re trying to convince decision-makers of the best choice.
The organized layout makes it easy to compare and contrast without overwhelming your audience. For only $0.99, you can download this slide and customize it to your liking. It’s easy to edit in PowerPoint and Google Slides, so you can have it ready for your next meeting in just a few minutes.
$0.99 – Purchase Checkout
Added to cart







