Evaluate Options with Comparative Analysis Layout
Product Description
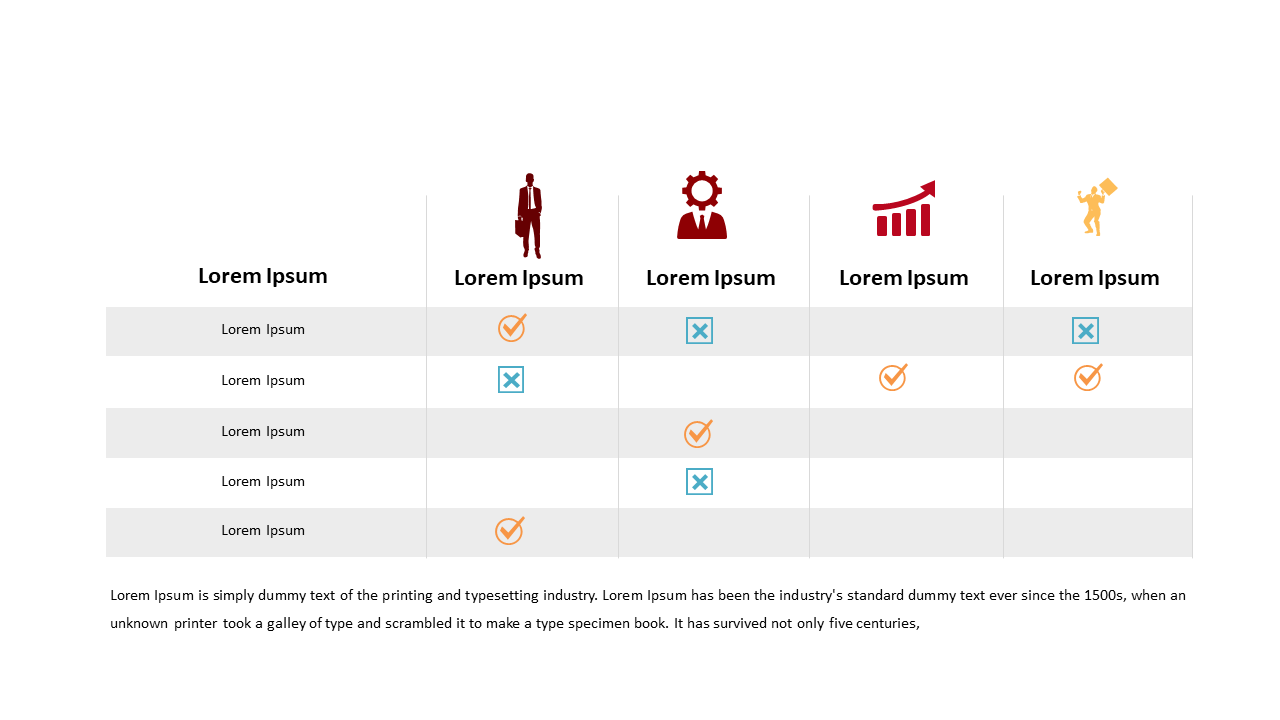
Deciding between multiple options can be a headache, especially when each choice has its own set of pros and cons. Presenting this information in a clear and straightforward manner is crucial to making informed decisions. This comparative analysis layout is designed to help you showcase various features and benefits clearly, making it easier for your audience to grasp the key differences.
Consider a product manager assessing software solutions, or a marketing director evaluating ad campaigns. This slide is perfect for team meetings where you need to dissect options, such as during project kick-offs or strategic planning sessions.
Its structured approach allows you to make compelling arguments for the best choice based on visual data. For just $0.99, you can download this slide and start using it immediately. It’s fully editable in PowerPoint and Google Slides, letting you customize it to fit your specific needs in minutes.
$0.99 – Purchase Checkout
Added to cart







