Feature Comparison Table for Effective Presentations
Product Description
In an environment where time is of the essence, presenting clear comparisons is vital for successful communication. A messy and disorganized approach can lead to misunderstandings that you want to avoid.
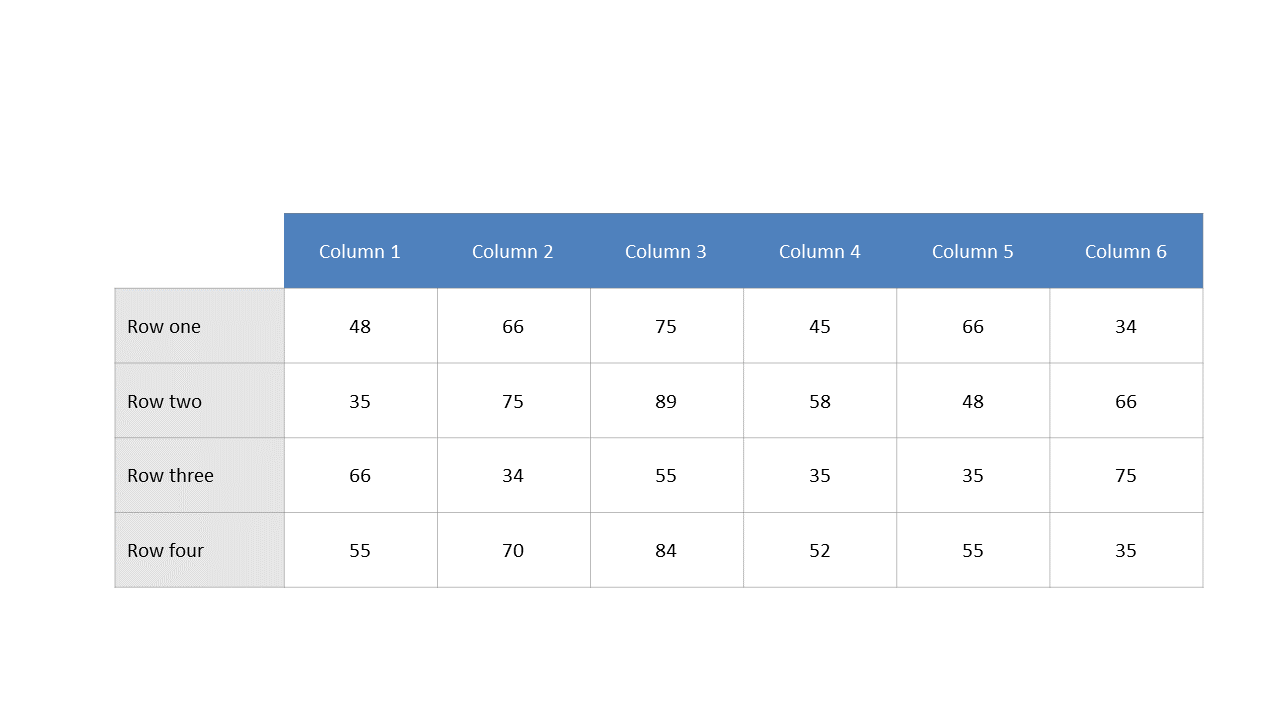
This slide offers a well-structured comparison table, specifically designed to make the comparison of multiple features straightforward and effective. Consider a business analyst preparing insights for a quarterly review, or a product developer needing to present alternative solutions to upper management. This slide is particularly useful for consultants advising clients on different packages, or any professional who needs to distill complex information into something easily digestible.
Available for just $0.99, this slide is ready for instant download. You can easily edit it in PowerPoint or Google Slides, so you can quickly adapt it to your specific presentation needs.
$0.99 – Purchase Checkout
Added to cart







