Visualize Performance with Circular Progress Comparison Table
Product Description
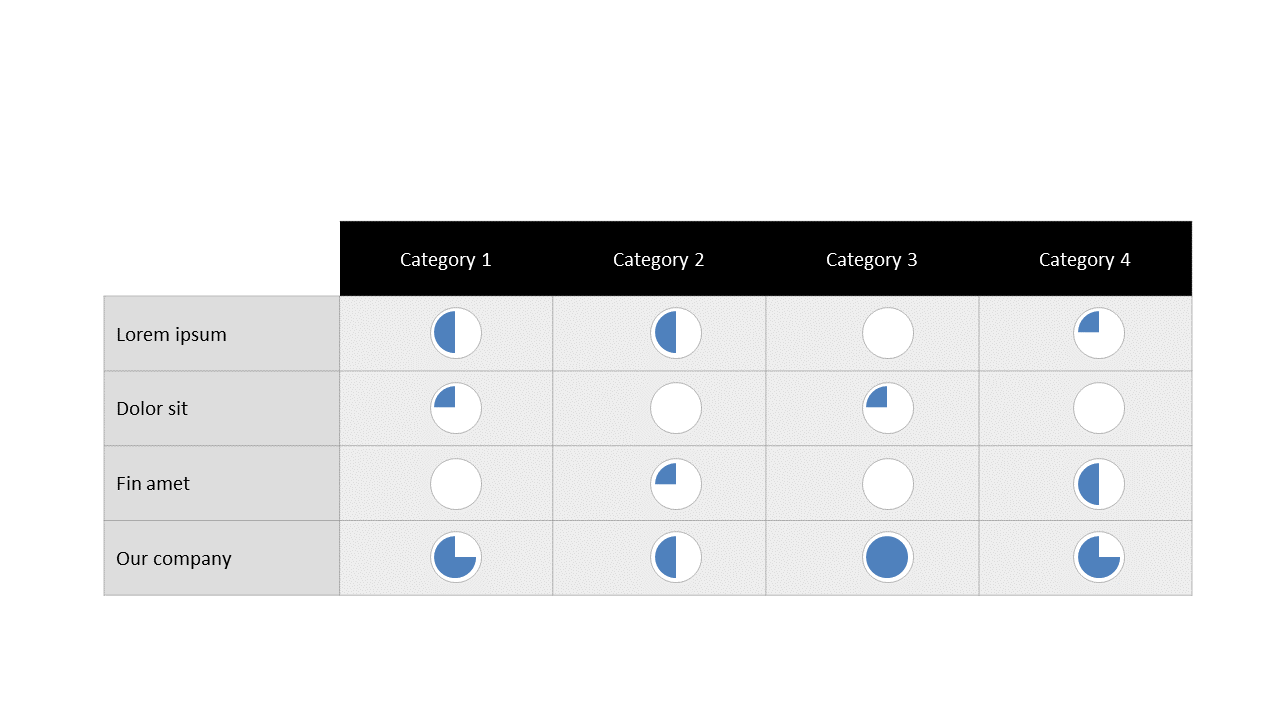
Delivering insights on performance can be challenging when the data is complex. You want your audience to grasp your message quickly, without losing them in technical details. This circular progress comparison table makes it easy to present performance metrics in a visually engaging manner.
Marketing managers, operations directors, and project leads will benefit from using this slide during status updates or performance reviews. It allows you to highlight progress against goals or compare the performance of different teams or initiatives in a way that’s easy to understand.
Your audience will appreciate the clarity that this slide brings to your crucial data. For just $0.99, you can download this slide instantly and make it your own in PowerPoint or Google Slides. It’s designed for easy customization, meaning you can have it ready to impress in minutes.
$0.99 – Purchase Checkout
Added to cart







