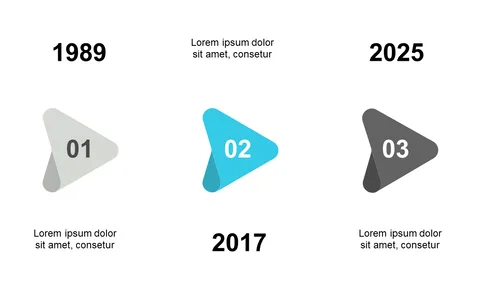
Showcase Key Dates with a Timeline Layout

Product Description
Tracking important project dates can feel like a juggling act, especially when deadlines start piling up. It’s all too easy for critical milestones to get lost in the chaos, leaving your team scrambling for clarity.
This timeline layout helps you clearly present key dates, ensuring your audience knows what to expect and when. This slide is perfect for project managers and team leaders in industries such as tech, construction, or marketing, especially during project kickoff meetings or progress updates. Whether you’re presenting to your team, upper management, or clients, this visual tool helps everyone stay aligned and informed.
For just $0.99, you can download this slide instantly. It’s easy to edit in both PowerPoint and Google Slides, allowing you to customize it to fit your specific project needs in minutes.
$0.99 – Purchase Checkout
Added to cart