Engage Audiences with a Colorful Circular Timeline
Product Description
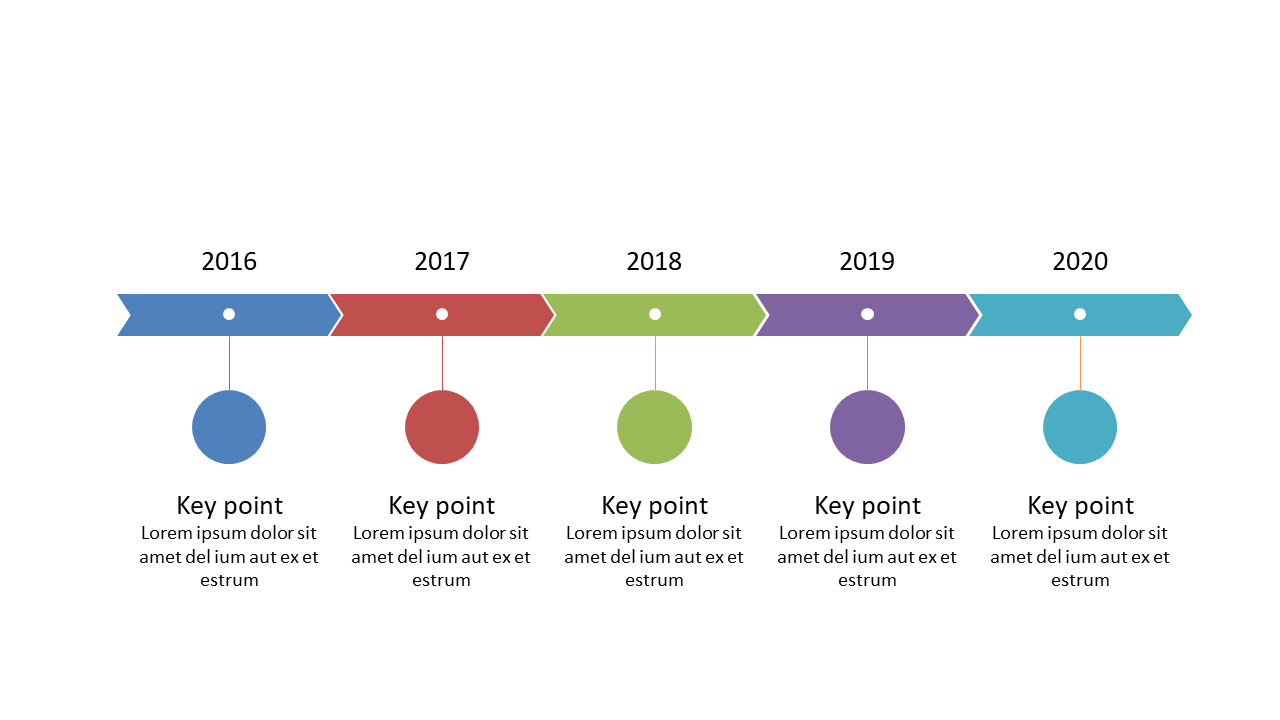
Engaging your audience while presenting complex data can be a tough mountain to climb. When dealing with project milestones or historical data, a traditional text-heavy slide might lose their attention quickly. This colorful circular timeline transforms your presentation, making it easier to connect with your audience and highlight essential points.
This slide is perfect for roles such as marketing managers, educational coordinators, and event planners who need to present timelines in meetings or workshops. If you’re preparing for a project update, a team brainstorming session, or even an educational lecture, this eye-catching design will keep your audience intrigued.
The vivid colors and connecting lines help to emphasize your key messages while making it visually appealing. For only $0.99, this slide is an instant download that’s easily editable in PowerPoint and Google Slides. Get it now to enhance your presentation and wow your audience in just minutes.
$0.99 – Purchase Checkout
Added to cart