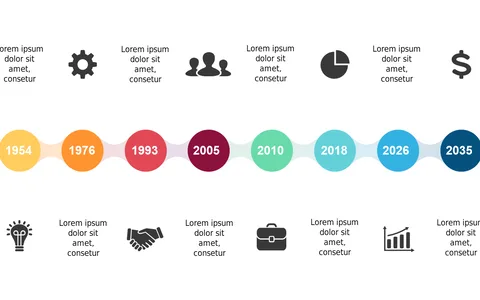
Highlight Key Events with a Milestone Timeline V2

Product Description
Juggling multiple projects can make it hard to showcase your milestones clearly, leaving your audience confused about your progress. This timeline slide helps you visualize key events in a straightforward manner, ensuring everyone can grasp the timeline of achievements at a glance.
Project managers in tech or marketing often need to present project timelines during stakeholder meetings or client briefings. This slide is perfect for illustrating project progress during weekly updates or quarterly reviews, making it an essential tool for any project-driven environment.
For just $0.99, you can download this slide instantly and edit it easily in PowerPoint or Google Slides. Customize the icons, text, and dates to fit your specific needs and present your milestones like a pro.
$0.99 – Purchase Checkout
Added to cart