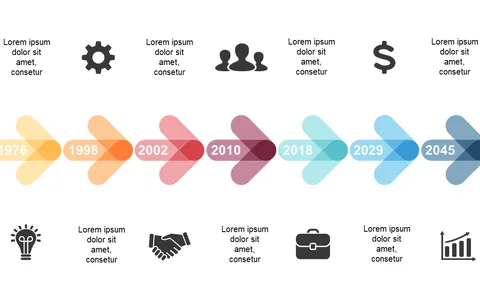
Engage Audiences with a Colorful Timeline Infographic

Product Description
Communicating timelines can feel overwhelming, especially when you want to keep your audience engaged. This colorful timeline infographic is designed to clearly present a sequence of events while capturing attention.
Its vibrant design helps highlight key milestones, making your narrative more compelling. This slide is ideal for project coordinators, event planners, or marketing professionals who need to share timelines during client presentations or team meetings. It helps bring clarity to projects in sectors such as hospitality, education, or entertainment.
At only $0.99, this slide is available for instant download and is easy to customize in PowerPoint or Google Slides. You’ll be ready to present a visually striking timeline in just a few minutes.
$0.99 – Purchase Checkout
Added to cart