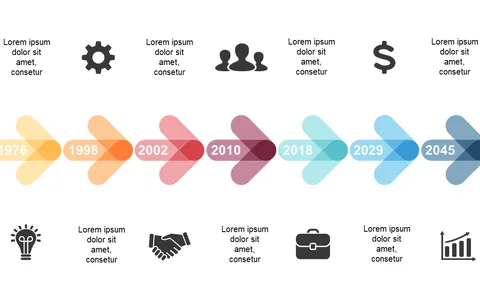
Showcase Key Events with a Triangular Milestone Timeline

Product Description
Conveying complex timelines can be tricky, especially for those looking to engage their audience effectively. This triangular milestone timeline slide simplifies that challenge by presenting key events in a visually compelling way.
The triangular shapes and icons help highlight milestones without overwhelming your audience with information. This is perfect for program managers in the education sector presenting project timelines to faculty, or operations managers detailing growth phases during quarterly reviews. If you’re leading a workshop, this slide can help illustrate your points clearly, ensuring that everyone understands the timeline of events.
You can grab this slide for just $0.99, and it’s ready for instant download. It’s fully editable in PowerPoint and Google Slides, allowing you to make it your own within minutes.
$0.99 – Purchase Checkout
Added to cart