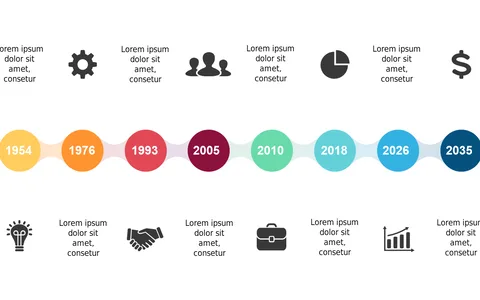
Visualize Key Events with Circular Timeline Layout

Product Description
When you need to present a detailed timeline of events, clarity becomes your greatest ally. Complex data can easily overwhelm your audience if it’s not presented in an accessible manner. This circular timeline layout simplifies the information, making it visually engaging and easy to understand.
This slide is perfect for project coordinators in the nonprofit sector or event planners outlining schedules during client meetings. It can also be beneficial for educators presenting historical timelines in a classroom setting, ensuring that key events stand out in a memorable way.
Make your presentations a breeze with this well-structured visual. For just $0.99, you can download this slide instantly, and it’s fully editable in both PowerPoint and Google Slides. Tailor it to fit your content effortlessly and enhance your presentations in minutes.
$0.99 – Purchase Checkout
Added to cart