Four-Section Puzzle Piece Comparison Layout
Product Description
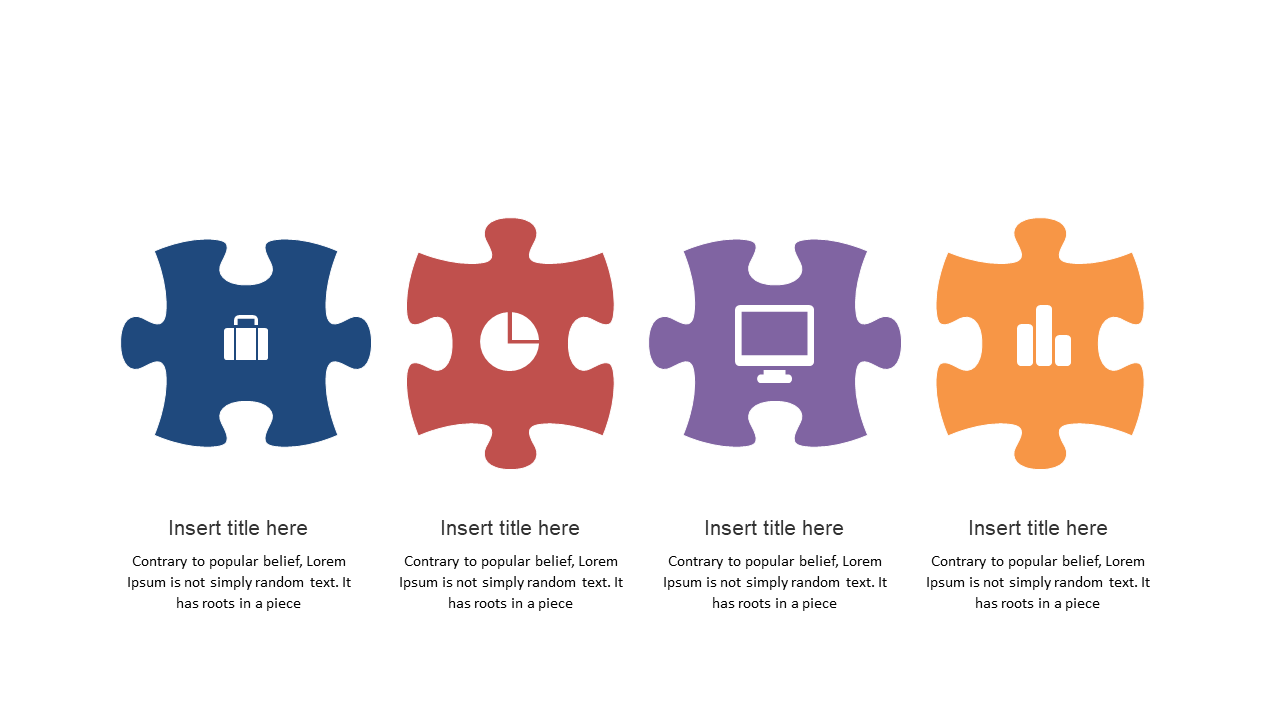
When dealing with multiple viewpoints or data points, clarity is essential but can be challenging to achieve. This slide offers four interconnected puzzle pieces that make comparisons visually appealing and straightforward, allowing your audience to easily grasp the relationships between ideas.
This layout is perfect for analysts presenting data comparisons, marketing teams evaluating different campaign strategies, or sales professionals contrasting product features. It helps you organize your thoughts and present them clearly, keeping your audience engaged throughout.
For just $0.99, you can download this slide and get started right away. It’s fully editable in PowerPoint and Google Slides, so you can quickly customize each puzzle piece to fit your specific content.
$0.99 – Purchase Checkout
Added to cart







