Visual Property Comparison for Real Estate

Product Description
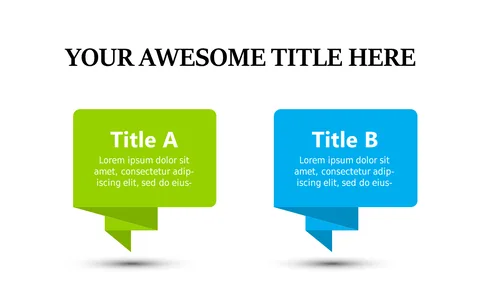
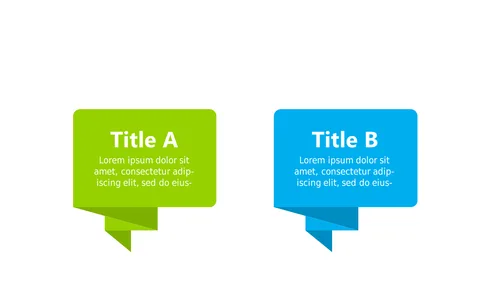
In the competitive realm of real estate, presenting clear property comparisons is essential for helping clients make informed decisions. Without a straightforward visual aid, potential buyers may struggle to understand the differences among various options. This slide provides a side-by-side comparison of two properties, designed to highlight key attributes with clarity.
Real estate agents, property managers, and investment analysts will find this slide invaluable during open houses, client consultations, or market analyses. It serves as a practical tool for showcasing features like price, location, and amenities in a way that’s easy for clients to digest.
When time is of the essence, this visual support can make your presentation more persuasive. Available for only $0.99, this slide can be downloaded instantly and is fully customizable in PowerPoint and Google Slides. You can easily edit it to fit your specific properties and branding within minutes.
$0.99 – Purchase Checkout
Added to cart