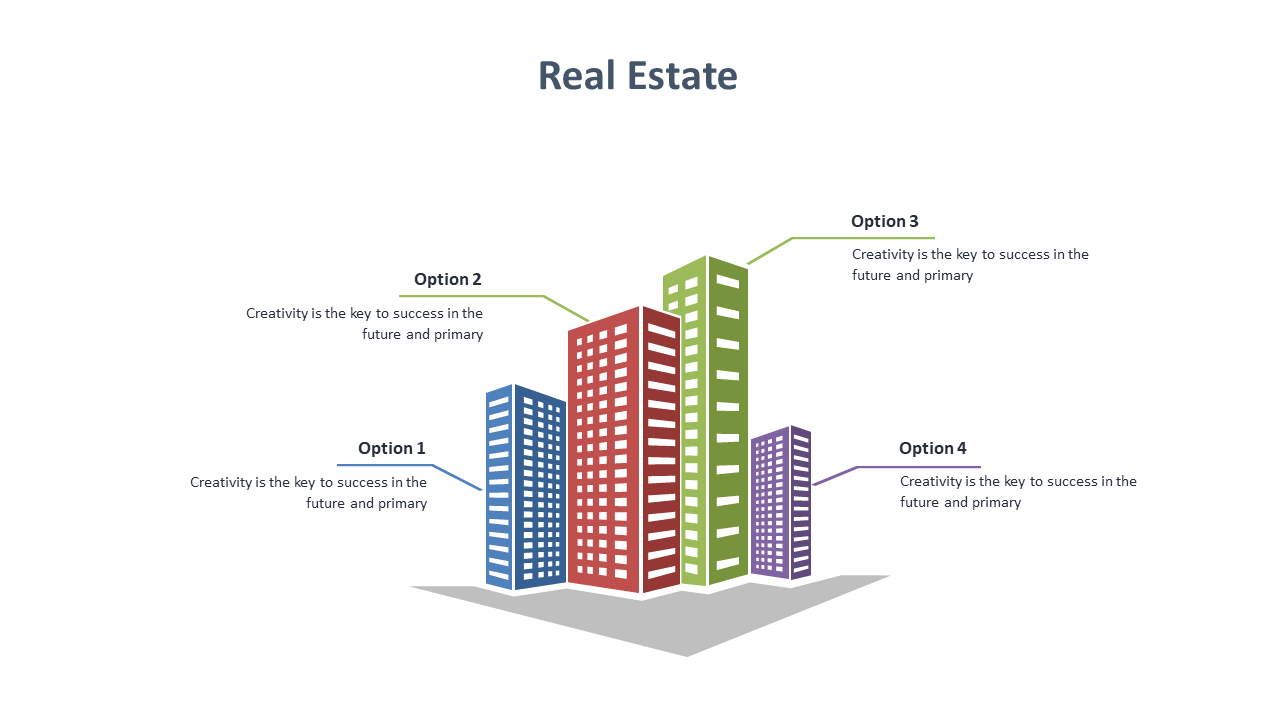
In today’s fast-paced real estate market, analysts often struggle to present multiple property options in a way that captures attention. A cluttered slide can confuse your audience and dilute your message. This single slide offers a visually compelling comparison of buildings, complete with bubble indicators that highlight key insights and descriptive annotations. The layout is clean and professional, ensuring that your audience can quickly grasp the differences between options presented. For analysts, this slide allows you to condense complex information into an easy-to-understand format that facilitates decision-making. As a consultant, you can use this slide to guide your clients through various real estate choices, showcasing the benefits of each option without overwhelming them. For sales leads, this slide serves as an excellent tool to engage potential buyers by clearly demonstrating the advantages of different properties.
You can easily customize text fields and colors to match your branding or presentation style.
$0.99 —
add this single slide to any deck from the SlideSwift Slide Library. No subscription needed. Mix slides from any category to build your perfect deck.
$0.99 – Purchase Checkout
Added to cart
 SlideSwift