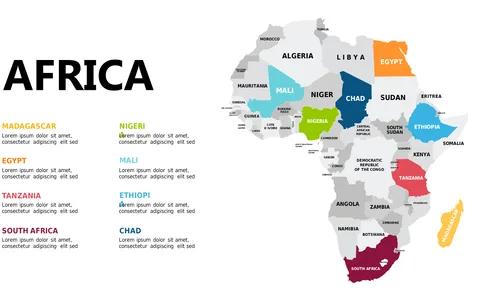
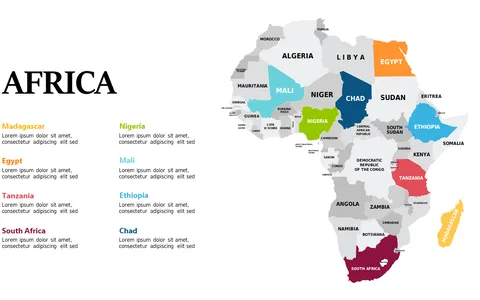
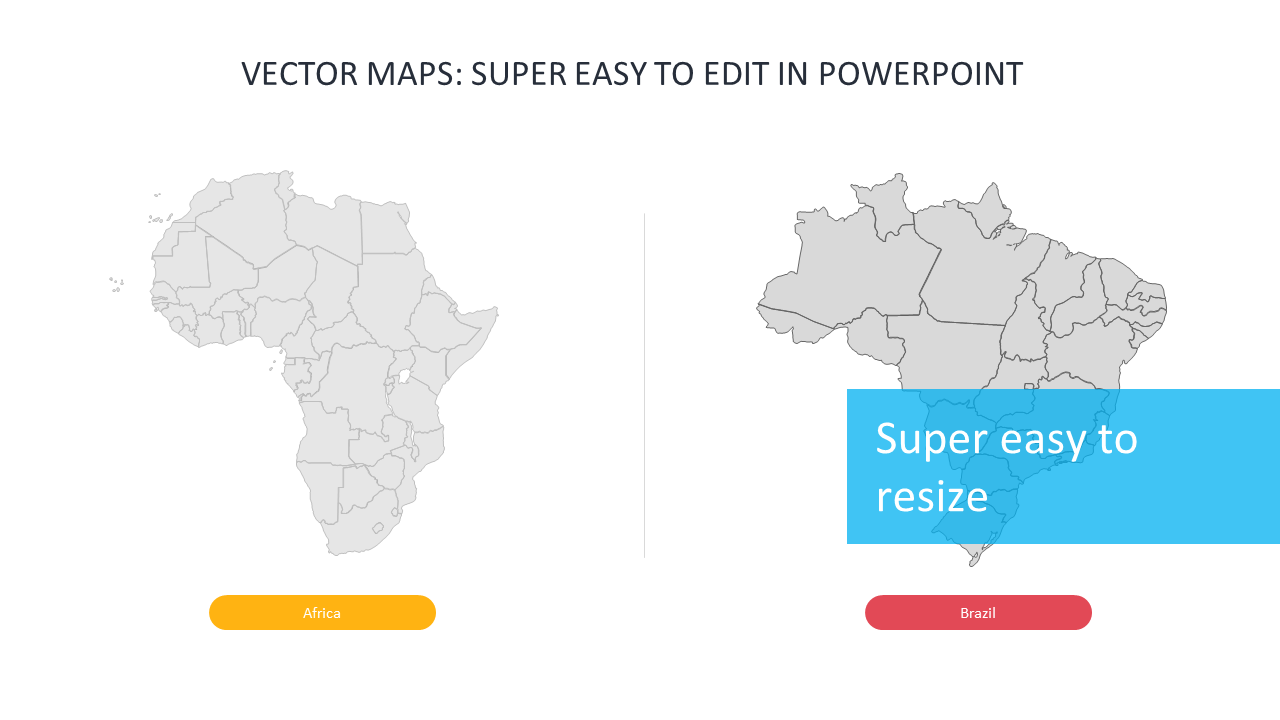
Compare Africa and Brazil with Dual Vector Maps
Product Description
When it comes to showcasing geographical comparisons, visuals matter. This dual vector map slide gives you a powerful tool to present contrasting data effectively, helping your audience visualize differences in a straightforward manner.
It’s a smart way to keep your audience engaged and informed. Geographers, business consultants, and market researchers will find this slide indispensable for presentations that require geographical comparisons, such as economic findings or resource allocations between Africa and Brazil. It’s perfect for workshops, strategic meetings, or educational settings where understanding geographic contexts is essential.
For the low price of $0.99, this slide is available for instant download. It’s designed for easy editing in PowerPoint and Google Slides, so you can adapt it quickly to suit your specific requirements.
$0.99 – Purchase Checkout
Added to cart