Showcase Investment Distribution with Callouts
Product Description
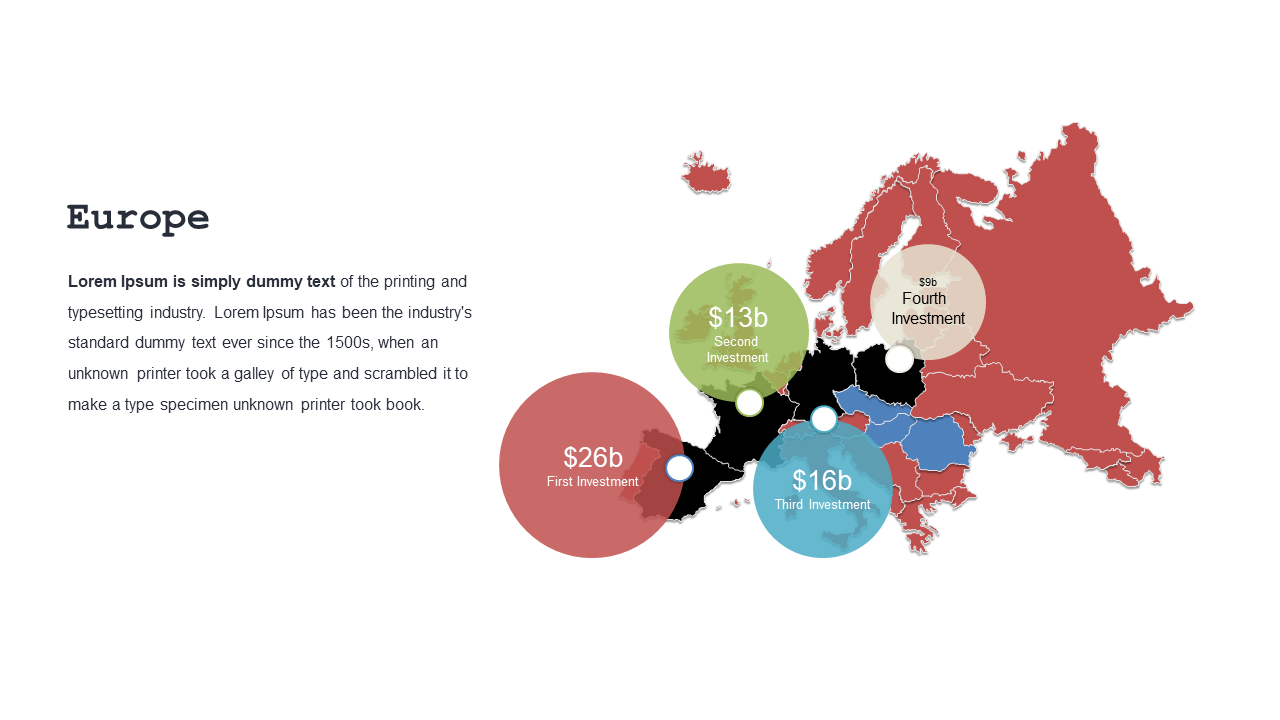
Presenting investment data can turn complex figures into a muddled mess if not done right. This slide helps you eliminate that confusion by showcasing a clear map that highlights various investments across a defined area. Each callout makes it easy for your audience to grasp important figures without getting lost in the details.
You’ll find this slide particularly helpful if you’re a financial analyst, investment advisor, or project manager needing to report on asset allocation or market entry strategies. Use it in meetings with potential investors or during internal reviews to make your investment distribution crystal clear.
For only $0.99, you can download this invaluable slide and make it your own. It’s easy to edit in PowerPoint and Google Slides, offering you a quick way to tailor it to your specific requirements. Have it ready for your next meeting in just minutes and watch your audience take notice.
$0.99 – Purchase Checkout
Added to cart