Visualize Weekly Tasks with Color-Coded Schedule
Product Description
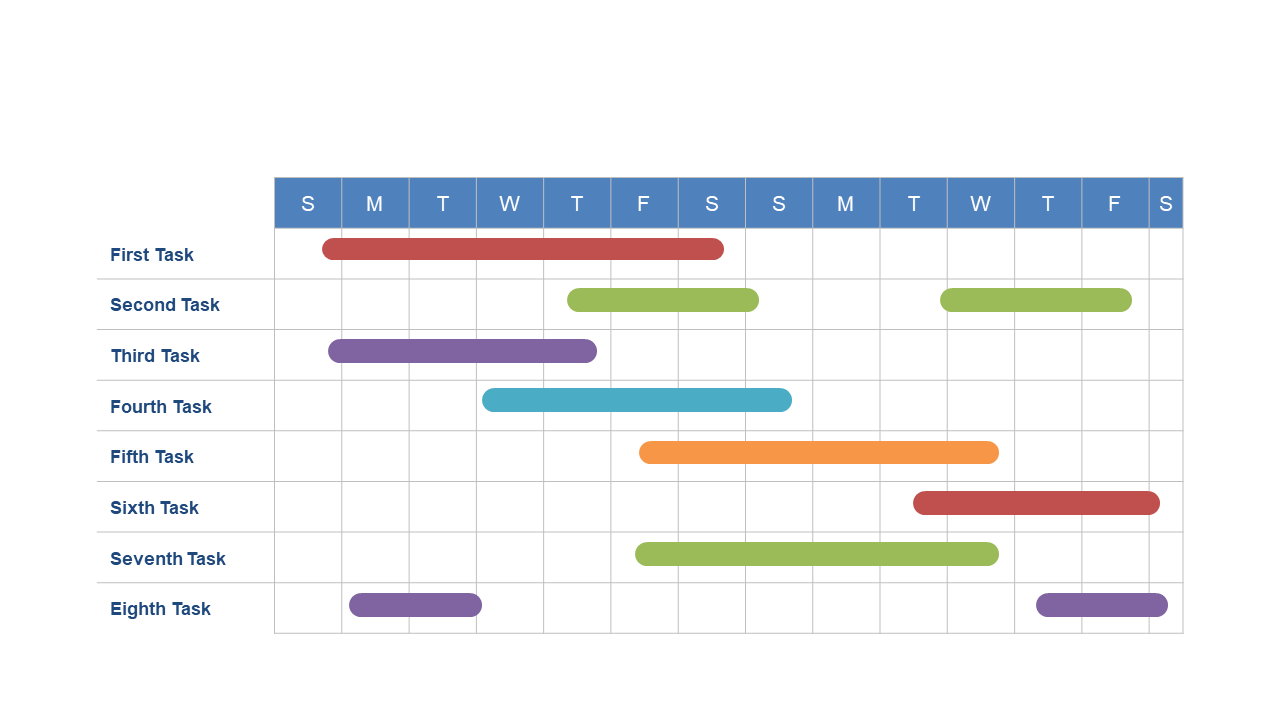
Keeping track of multiple tasks across several projects can feel overwhelming at times. Often, it’s hard to know what to prioritize or when deadlines are approaching. This color-coded weekly task schedule helps you visually organize your tasks, making it easier to stay on top of your responsibilities and ensuring nothing falls through the cracks.
This slide is ideal for project managers juggling different timelines, as well as team leaders coordinating work among multiple teams. It fits perfectly into weekly planning meetings or status updates. By using visual cues, you can quickly communicate what needs to get done and by when.
At just $0.99, this slide is an instant download, ready for you to edit in both PowerPoint and Google Slides.
You can customize it in no time to fit your specific projects, making your task management more effective.
$0.99 – Purchase Checkout
Added to cart