Visualize Weekly Performance Metrics with Bar Chart
Product Description
Finding a way to present your weekly performance metrics in a compelling manner can be a challenge. You need a visual that not only shows the data but also drives home the key points for your audience.
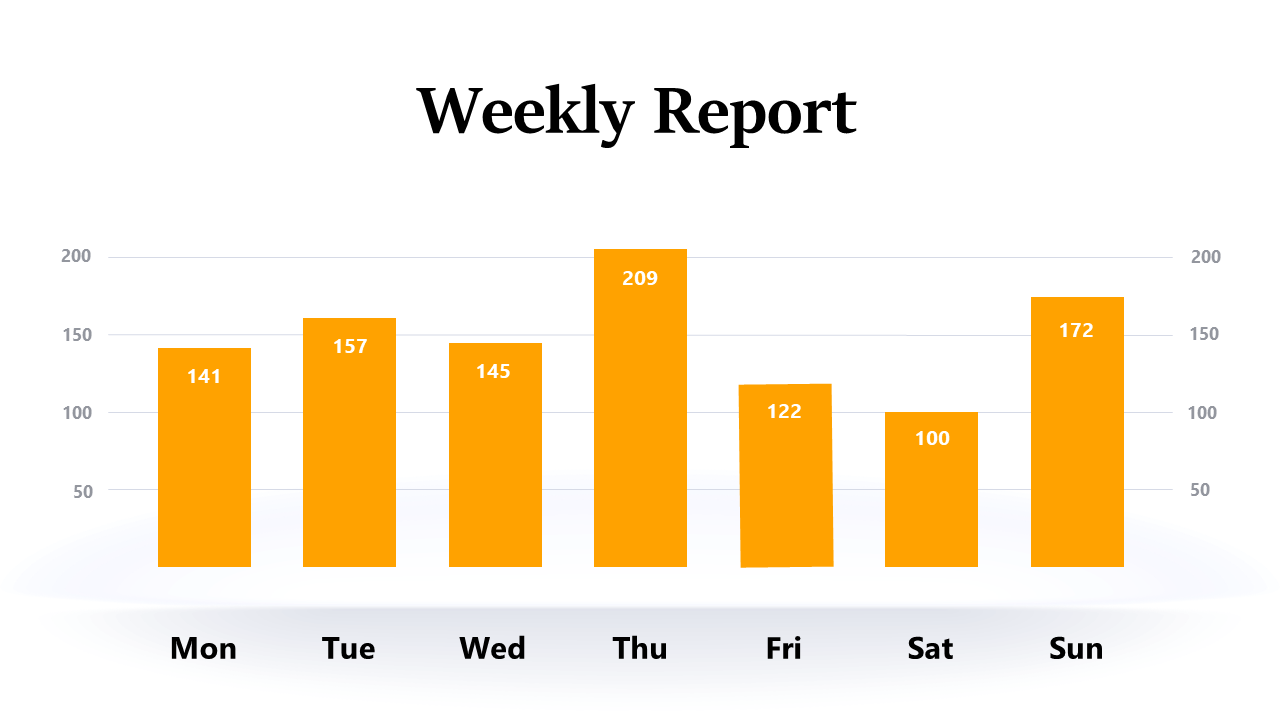
With this bar chart slide, you can easily compare values from multiple days, enabling informed discussions that can lead to effective decision-making. Sales managers and operation leads in industries like retail or manufacturing will find this slide invaluable during weekly performance reviews or team meetings. When you’re under pressure to convey complex data in a short amount of time, this chart simplifies the process, allowing your team to focus on what really matters: the metrics that drive success.
You can download this editable bar chart for just $0.99, and it works seamlessly in PowerPoint and Google Slides. With a straightforward design, you’ll be ready to present in minutes, ensuring that your data is not only accurate but also engaging.
$0.99 – Purchase Checkout
Added to cart







