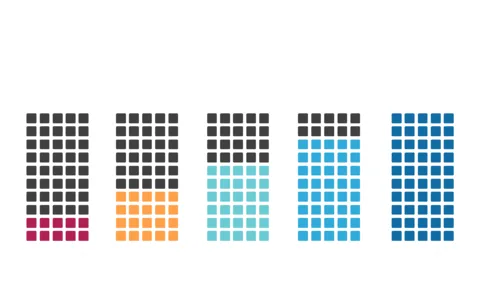
Compare Skills with Horizontal Bar Chart Template
Product Description
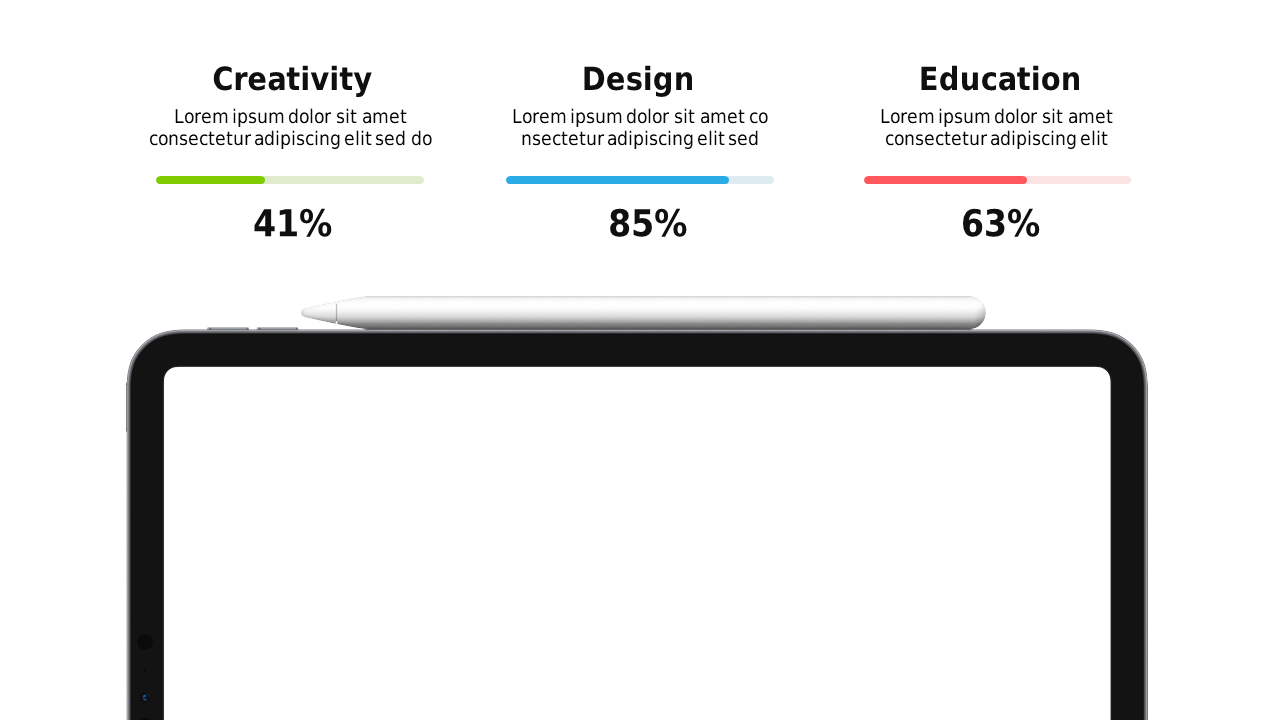
When showcasing skill levels, it’s crucial to present data in a way that’s both clear and impactful. This horizontal bar chart template allows you to visually compare different skills, making it easy for your audience to grasp where strengths lie.
It’s perfect for HR professionals conducting performance reviews or team leaders assessing skills during project planning sessions. Whether you’re working in tech, design, or sales, this chart can effectively communicate your team’s capabilities.
For only $0.99, you can download this editable chart today. It’s compatible with both PowerPoint and Google Slides, so you can adjust the skills and values to reflect your specific needs in just a few clicks.
$0.99 – Purchase Checkout
Added to cart
✅ Instant delivery
✅ Fully editable
✅ PowerPoint & Google Slides
Category:
$0.99
Per slide · No minimum · Pay only for what you pick
✓ $0.99/slide
No minimum order
✓ Mix any category
No subscription
Building a full deck?
Mix slides from any of our 58 categories —
all merged into one PowerPoint.
$0.99/slide, no minimum.
Browse All Slides →