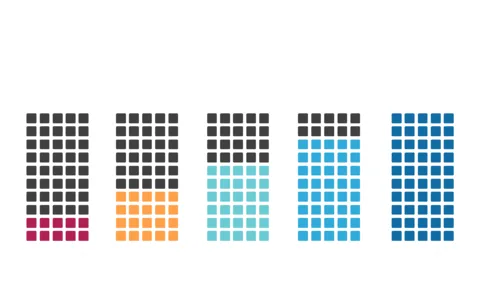
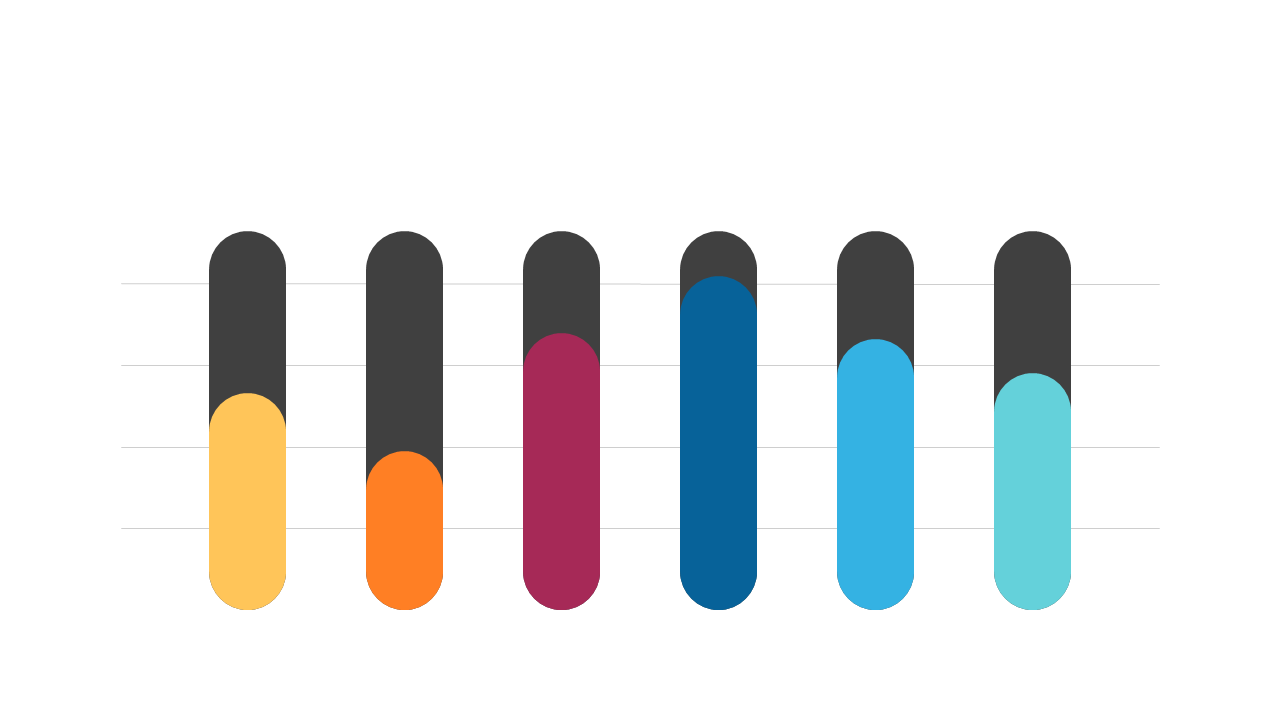
Gradient-Filled Horizontal Bar Graph for Data
Product Description
When it comes to presenting data, clarity is key. Complex information can overwhelm your audience, so a visually appealing format is essential to convey your message effectively.
This gradient-filled horizontal bar graph helps simplify data comparisons, allowing you to present complex information clearly and attractively. Data analysts and business leaders will find this slide indispensable for reporting quarterly results, while marketers can use it to showcase campaign performance metrics. Its editable bars and colors offer an easy way to customize the slide to suit your dataset and branding, making your insights more relatable.
You can grab this slide for just $0.99 and download it instantly, editing it in PowerPoint or Google Slides to suit your needs. It’s an easy way to enhance your data presentations and make a lasting impression.
$0.99 – Purchase Checkout
Added to cart