Present Data Clearly with Vertical Bar Chart
Product Description
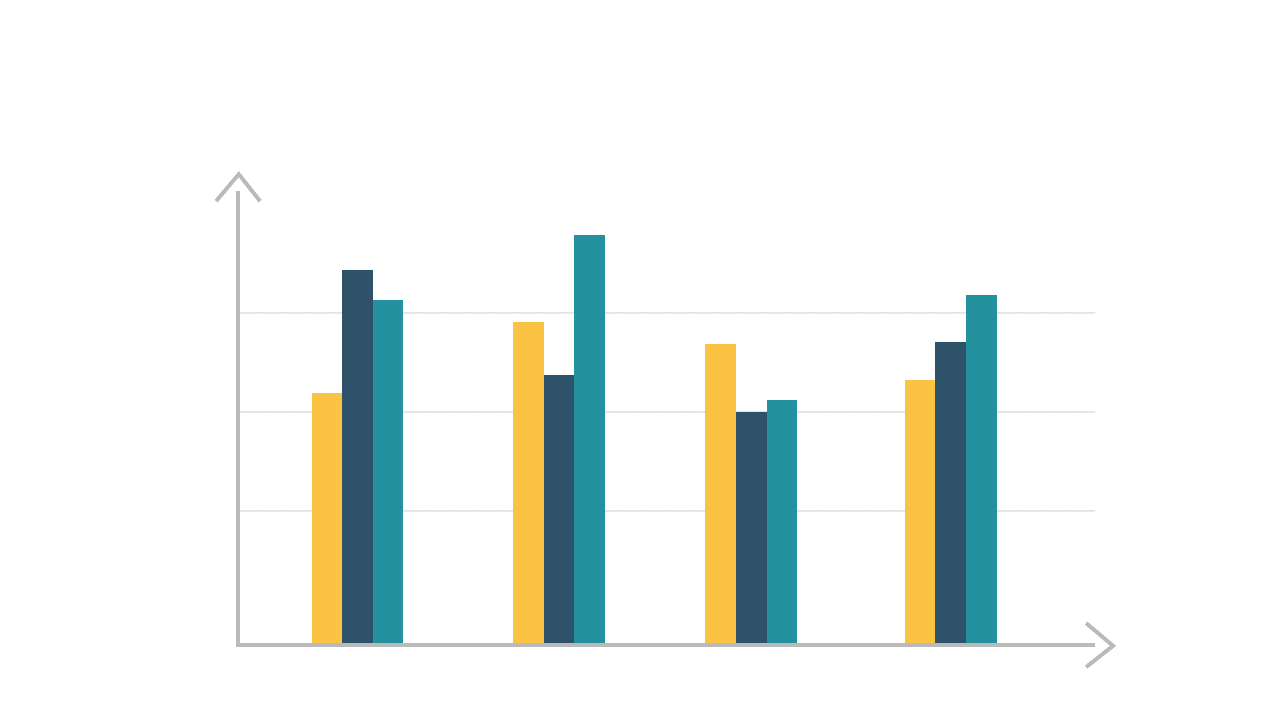
Making data clear and impactful can feel like a constant struggle in your professional life. This vertical bar chart slide takes the guesswork out of presenting statistics, featuring a clean layout and a trend arrow to guide your audience’s focus on key insights.
This slide works wonders for operations managers during performance reviews, sales teams pitching results to executives, or educators presenting research findings to stakeholders. No matter your industry, having a straightforward visual can enhance your storytelling and keep your audience engaged.
For just $0.99, this slide is an easy, cost-effective way to boost your presentation. It’s instantly downloadable and simple to edit in PowerPoint and Google Slides, making it a breeze to tailor to your specific data needs in just a few clicks.
$0.99 – Purchase Checkout
Added to cart







