Compare Data with Vertical Bar Chart Indicators
Product Description
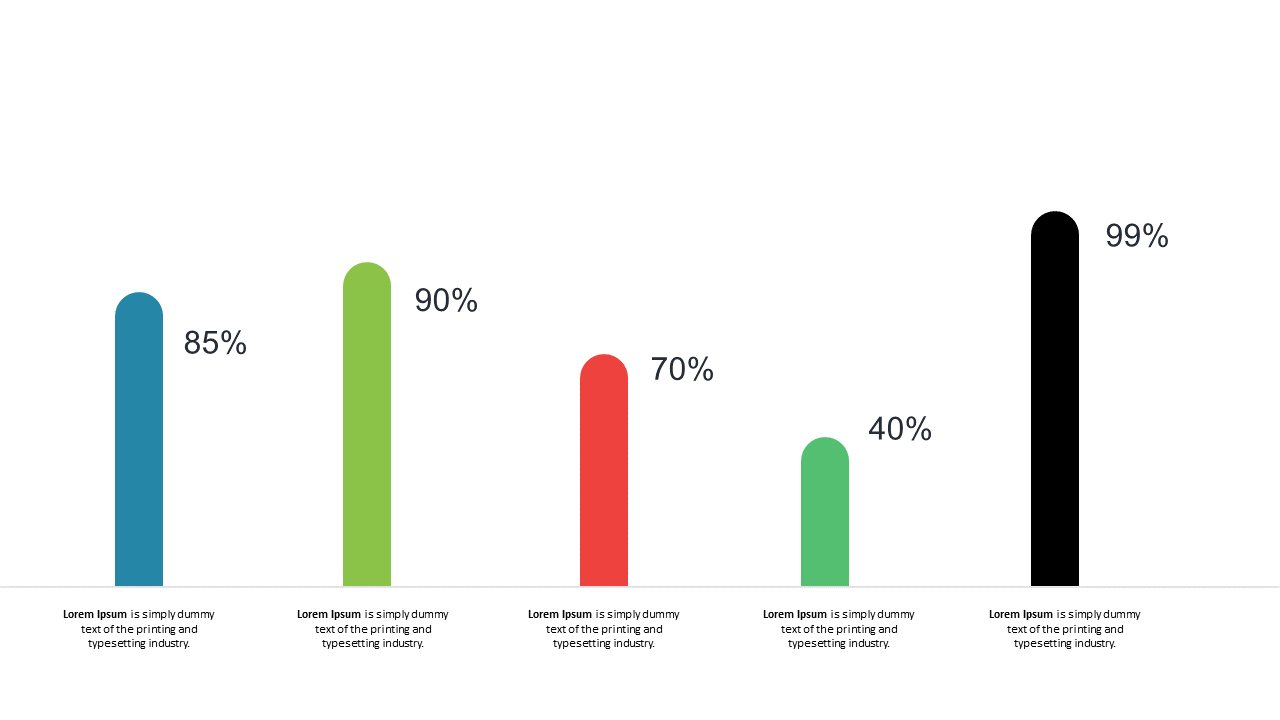
Data can often feel overwhelming, especially when you need to present your findings in a way that’s easy to digest. The vertical bar chart in this slide helps simplify complex datasets, allowing your audience to compare key metrics with clarity and speed. It’s designed to ensure that important figures catch the eye and make a lasting impression.
Business analysts, data scientists, and financial professionals will find this slide incredibly useful for meetings, presentations, or reports where data comparison is crucial. Whether you’re discussing quarterly sales figures or performance trends, this chart provides a straightforward way to communicate your analysis effectively.
It’s ideal for team updates, board presentations, or client meetings where clarity is key. For just $0.99, this slide is ready for instant download and is fully editable in PowerPoint and Google Slides. You’ll be able to tailor it to your specific needs in just minutes, giving you the freedom to create a polished presentation without the hassle.
$0.99 – Purchase Checkout
Added to cart







