Visualize Trends with Vertical Bar Chart
Product Description
Finding the right way to present data trends can be tough, especially when time is limited and clarity is a must. You want your audience to understand the story behind your numbers without getting lost in details.
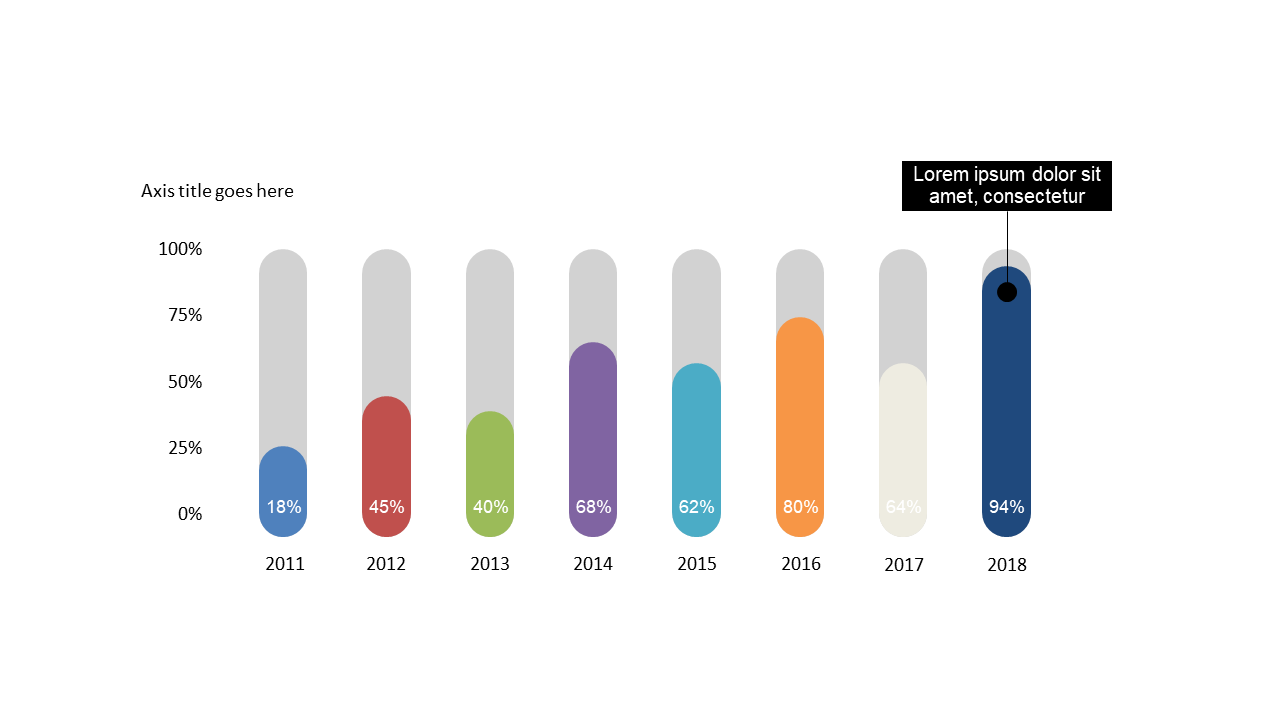
This vertical bar chart provides a straightforward, visually compelling way to represent data trends over time. Data analysts can use this slide to present annual performance metrics in board meetings, while sales managers might employ it to showcase revenue growth across multiple quarters. It’s also perfect for researchers comparing findings over different years in academic presentations.
For only $0.99, this slide is an instant download that you can easily edit in PowerPoint or Google Slides. Tailor it to your specific needs and have an impactful visual ready in no time.
$0.99 – Purchase Checkout
Added to cart







