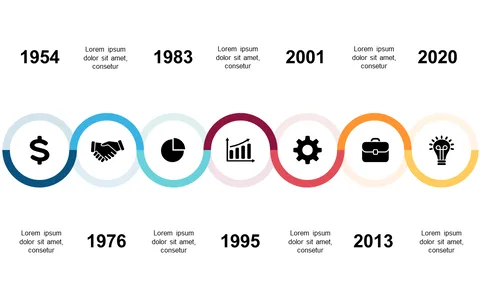
Track Milestones with Key Events Timeline

Product Description
Juggling multiple projects often leads to a cluttered overview of key milestones, leaving your audience overwhelmed. The clarity of your communication is critical, and this timeline layout helps you present key events in a straightforward way, making your updates memorable and comprehensible.
You’ll set the stage for effective discussions without losing your audience along the way. This slide is ideal for project managers coordinating team efforts, marketing professionals tracking campaign milestones, or even finance analysts presenting year-over-year growth at quarterly reviews. It’s designed for anyone who needs to highlight crucial events across various timelines, all while keeping the communication succinct and impactful.
At just $0.99, this slide is an easy addition to your presentation toolkit. It’s ready for instant download, and you can easily edit it in PowerPoint or Google Slides to align with your specific projects and timelines.
$0.99 – Purchase Checkout
Added to cart