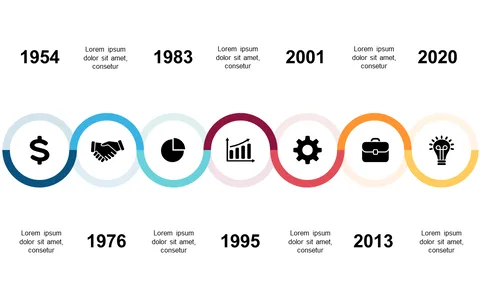
Present Milestones with Timeline Layout

Product Description
Communicating milestones can be a daunting task, especially when trying to keep everyone informed about progress. You need a clear visual representation that can make complex timelines easy for your audience to grasp.
This timeline layout simplifies the presentation of key milestones, ensuring that everyone stays aligned and on track. This slide is perfect for project managers who need to showcase project timelines during updates or for event planners coordinating timelines for upcoming events. Business analysts can also effectively use it to illustrate achievements within various phases of a project.
For just $0.99, this slide is available for instant download and is simple to edit in PowerPoint or Google Slides. In just a few clicks, you’ll have a polished visual that clearly presents your milestones to any audience.
$0.99 – Purchase Checkout
Added to cart