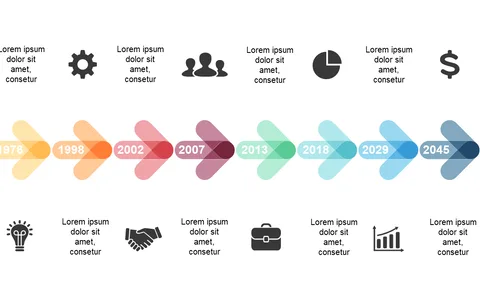
Present COVID-19 Milestones with Virus Shapes

Product Description
Showcasing significant milestones can be challenging, especially when presenting data related to events like the COVID-19 pandemic. This slide features colorful virus-shaped markers to represent these milestones, making it visually engaging and informative. It’s designed to communicate timelines effectively to your audience.
Health professionals, researchers, and public health officials will find this slide particularly useful when discussing key events, vaccine rollouts, or policy changes. It can also serve educators who are addressing pandemic history in classrooms or community leaders who want to inform the public about health initiatives. The intuitive design helps convey critical information clearly.
For just $0.99, you can download this timeline slide instantly. It’s fully editable in PowerPoint and Google Slides, so
you can customize it to your specifications in no time.
$0.99 – Purchase Checkout
Added to cart