Visualize Statistical Data with Bar Graph
Product Description
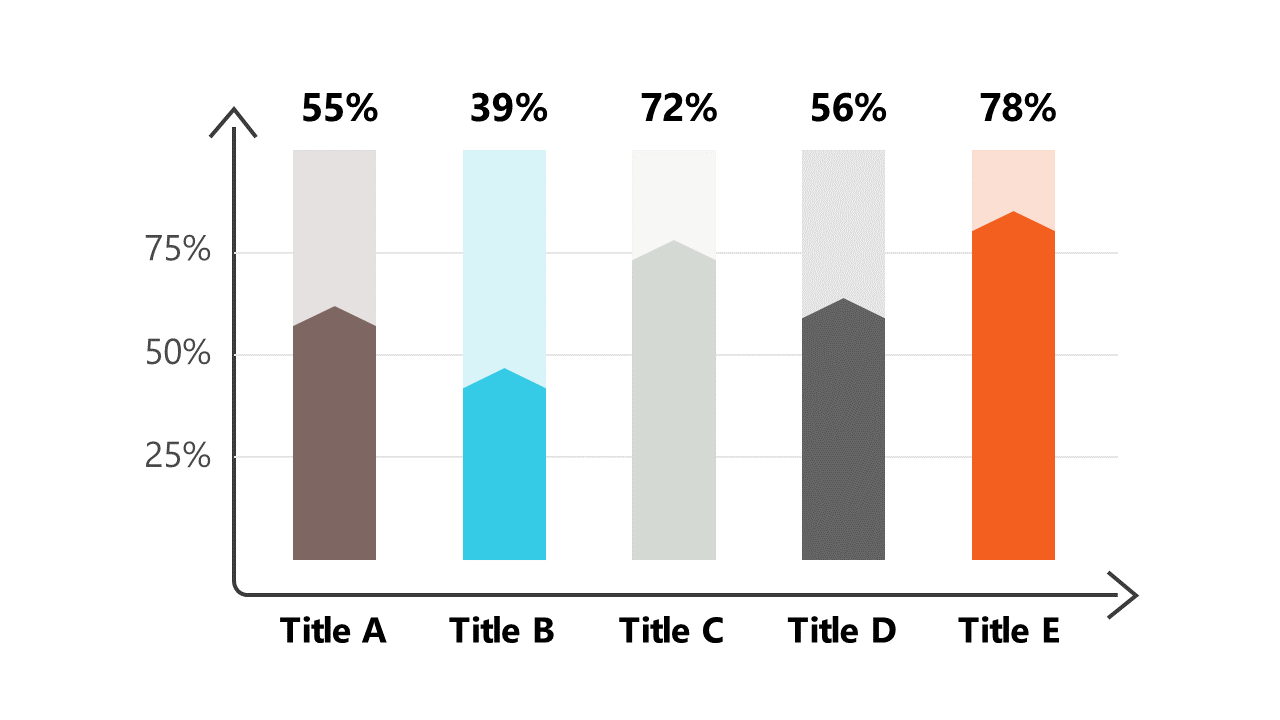
In a fast-paced data-driven environment, presenting statistics clearly and effectively is a constant challenge. You want to hold your audience’s attention while distilling complex information into digestible visuals, and this bar graph is designed to do just that.
With trend indicators, it enhances your data storytelling. This slide is particularly useful for data analysts preparing reports for executives, researchers summarizing findings, or product managers presenting user metrics. No matter the context, it provides a straightforward way to illustrate critical insights, making your analysis more impactful.
Available for only $0.99, this slide is ready for instant download and easy customization. You can edit it quickly in PowerPoint or Google Slides, ensuring it fits perfectly into your presentation style.
$0.99 – Purchase Checkout
Added to cart







