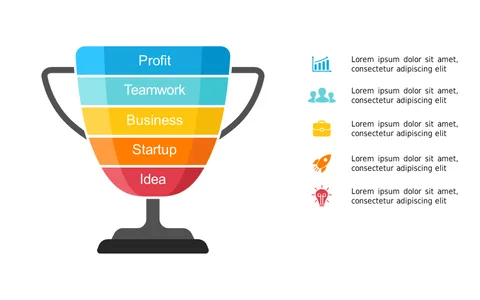
Illustrate Business Growth with Stacked Trophy Diagram

Product Description
When presenting your growth strategies, lack of clarity can lead to confusion and disengagement. This stacked trophy diagram vividly illustrates key concepts related to business growth, helping you convey important messages about Profit, Teamwork, and Startup ambitions more effectively.
Ideal for business development managers, sales directors, and entrepreneurs, this slide is particularly useful during pitch meetings or quarterly reviews where you need to highlight growth strategies.
It ensures your audience sees the progression of ideas in a structured, engaging way that encourages discussion. You can grab this slide for only $0.99, and once downloaded, it’s quick to edit in PowerPoint or Google Slides, allowing you to customize it in no time.
$0.99 – Purchase Checkout
Added to cart