Showcase Success Hierarchy with Pyramid Design
Product Description
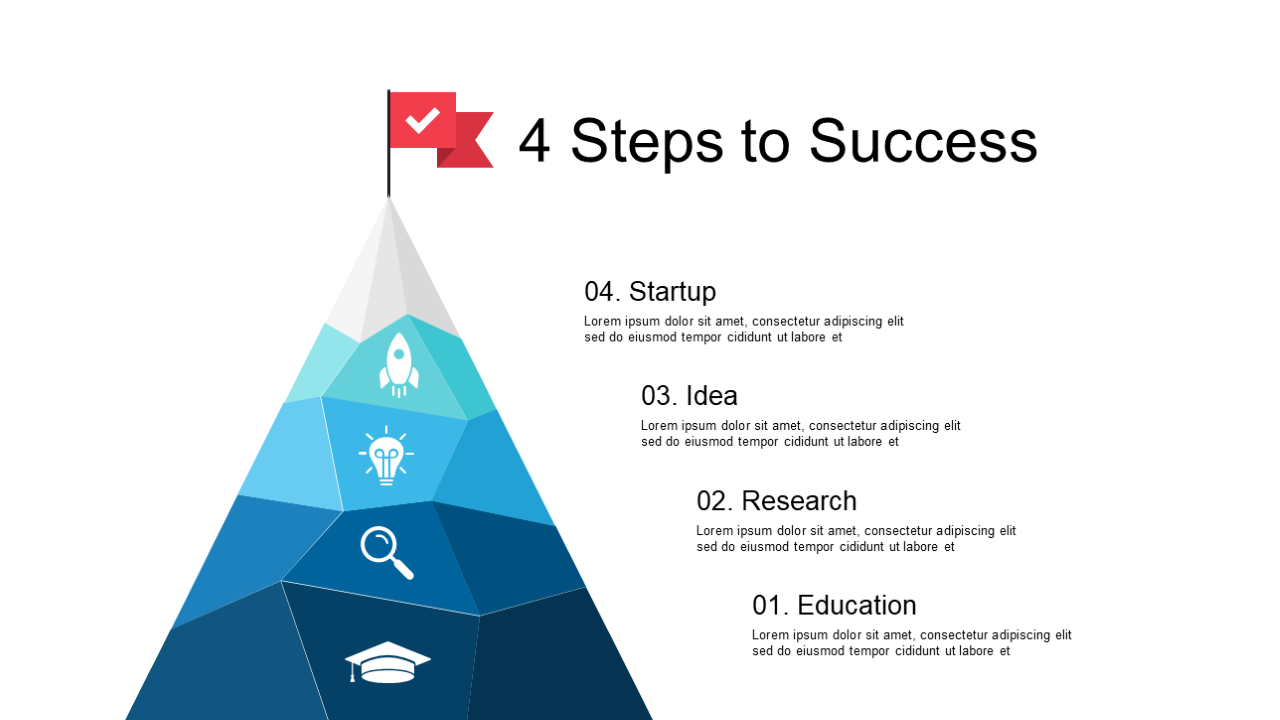
Clear communication about success hierarchies can be challenging, especially in dynamic environments where every detail counts. This pyramid design effectively illustrates layers of success, providing your audience with a visual guide to understanding the hierarchy and its implications effortlessly.
Ideal for corporate trainers developing workshops, business coaches guiding clients through growth strategies, or project managers presenting progress in team meetings, this slide makes conveying complex information accessible. You’ll be able to highlight various success factors and their relationships, turning abstract ideas into concrete visuals.
Download this slide for only $0.99 and get started right away. It’s fully editable in PowerPoint and Google Slides, so you can modify it to fit your specific message and branding quickly.
$0.99 – Purchase Checkout
Added to cart