Highlight Key Growth Areas with Stacked Trophy Diagram
Product Description
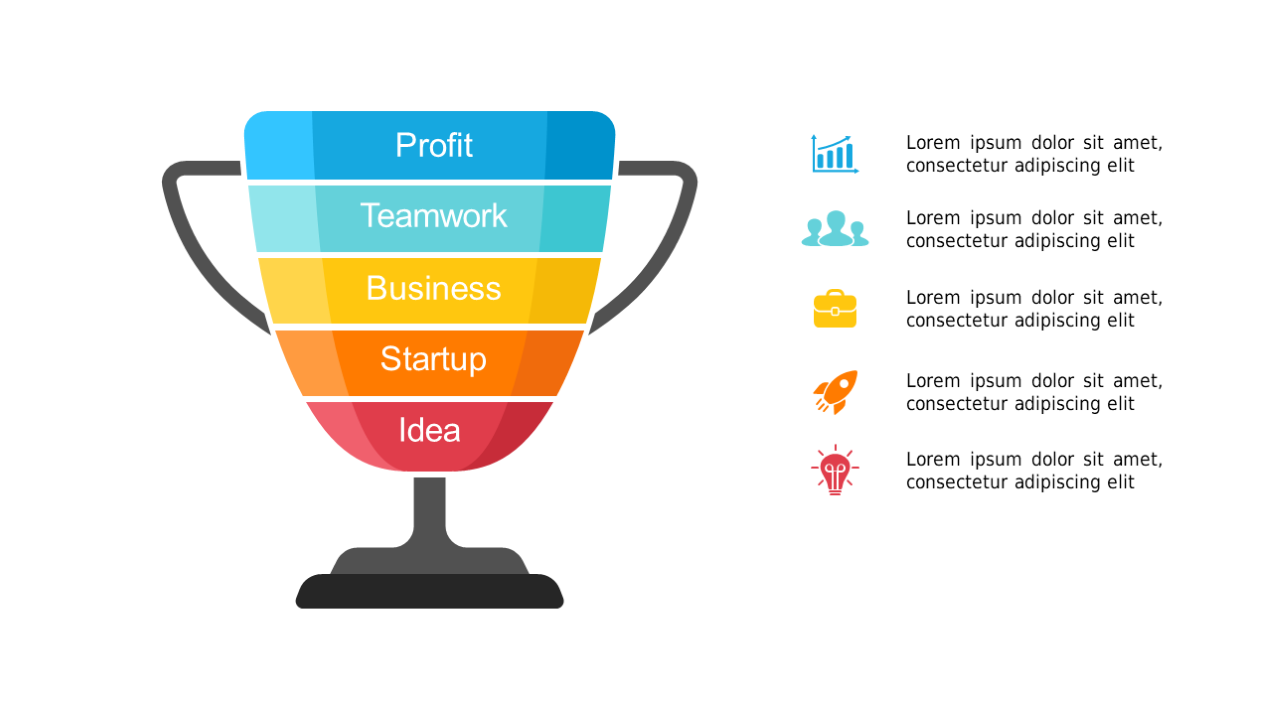
It’s challenging to keep your audience focused when discussing the intricacies of growth areas. This stacked trophy diagram not only simplifies your message but also visually represents layers of business concepts like Profit and Teamwork, making your points resonate more with your audience.
Perfect for consultants, financial analysts, or team leaders, this slide can be used in project update meetings, strategy sessions, or even training workshops to emphasize the importance of various growth areas. It helps convey the significance of each layer in a way that’s easy for everyone to understand.
For just $0.99, you can download this engaging slide and customize it as needed in PowerPoint or Google Slides. Editing is a breeze and will have you ready for your presentation in minutes.
$0.99 – Purchase Checkout
Added to cart