Compare Social Media Engagement with a Bar Chart
Product Description
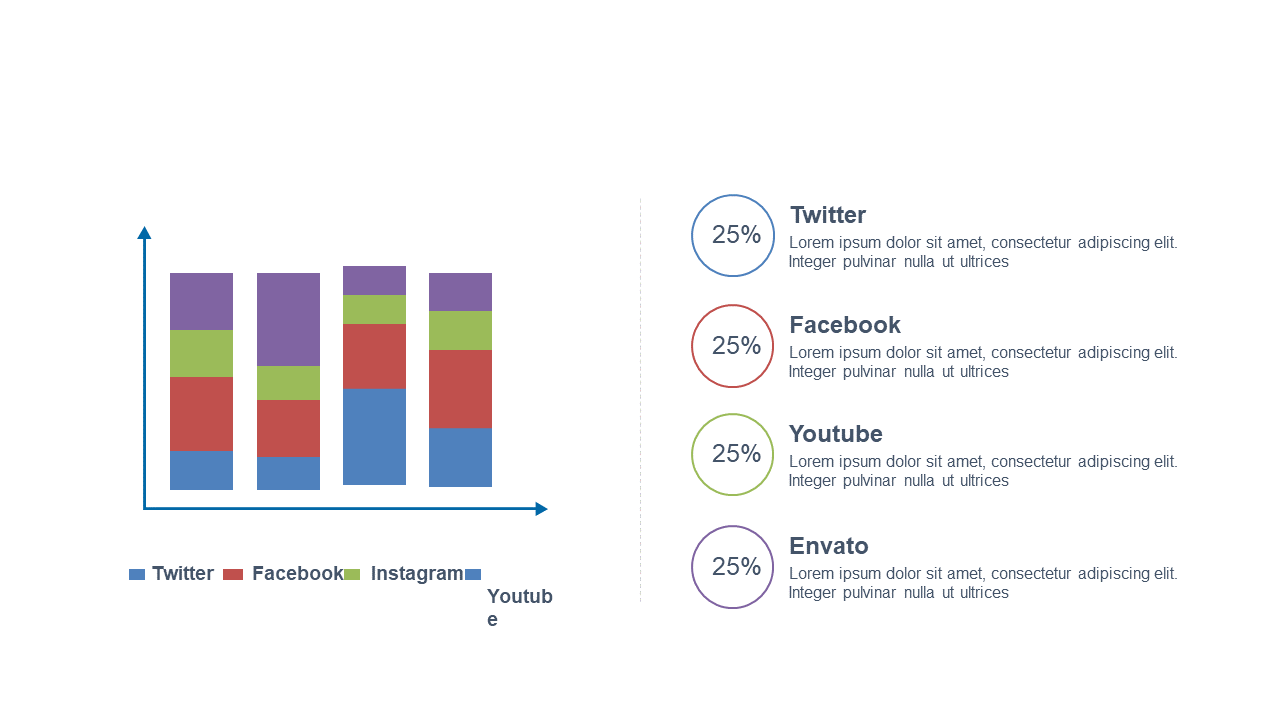
Presenting social media engagement metrics can often lead to confusion, especially when trying to differentiate between multiple platforms. You need a straightforward way to show how users interact with your content without overwhelming your audience.
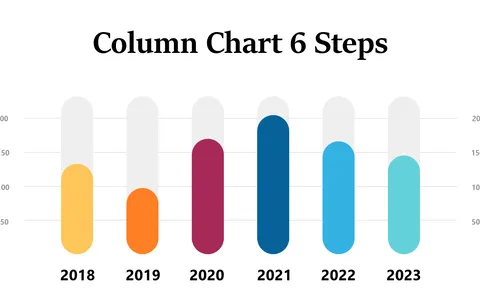
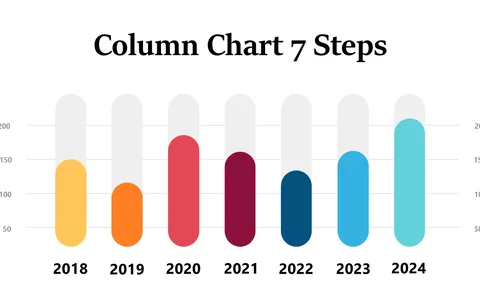
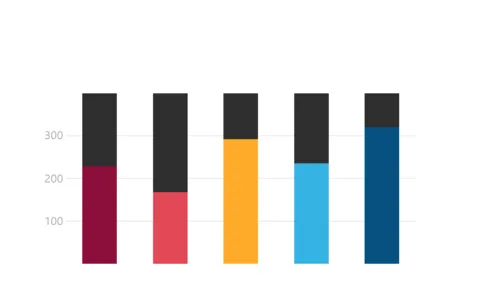
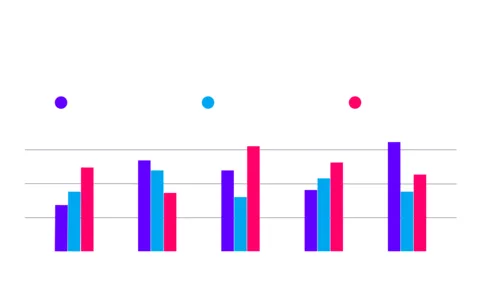
This slide uses a bar chart to break down engagement by platform, making it easier for everyone to grasp the data at a glance. This slide is perfect for business analysts dissecting audience interactions, content marketers showcasing campaign results, or even team leaders reviewing performance in social media strategy meetings. By presenting your data visually, you can ensure your insights resonate with your team and drive your strategy forward.
At just $0.99, this slide is available for instant download and can be easily customized in PowerPoint or Google Slides. You’ll have it ready for your next presentation in no time.
$0.99 – Purchase Checkout
Added to cart