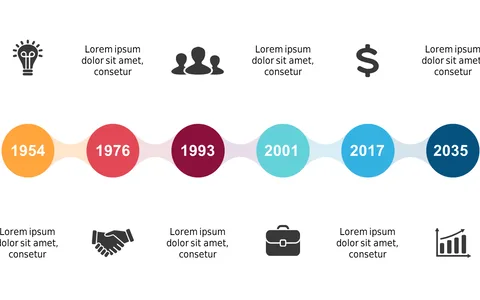
Track Project Milestones with a Segmented Timeline

Product Description
Tracking project milestones can quickly become a messy affair without a clear visual guide. This segmented timeline slide solves that problem by breaking down project milestones into distinct segments, making it easy for everyone involved to see progress and deadlines at a glance.
You can wave goodbye to confusion about where the project stands. This slide is particularly beneficial for project coordinators, team leaders, and operations managers who are involved in managing complex projects across various industries. Whether you’re leading a project kickoff meeting, providing updates in a status report, or reviewing timelines with your team, this slide will help keep everyone aligned.
For just $0.99, you can download this slide instantly and customize it to suit your project’s needs in PowerPoint or Google Slides. Editing is a breeze, ensuring you can focus on what matters most: your project’s success.
$0.99 – Purchase Checkout
Added to cart