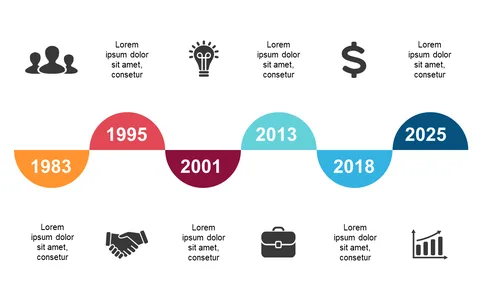
Highlight Key Milestones in Success Timeline

Product Description
Conveying your journey and key milestones can be challenging, especially when you want to make the progress tangible for your audience. You need a way to visually depict your accomplishments over time so that stakeholders can easily grasp the narrative behind your success story.
This slide is a great fit for project managers presenting quarterly results, sales directors reporting on annual achievements, or consultants outlining a client’s progress in a strategic plan. It allows you to highlight important dates and accomplishments, making it perfect for team meetings, annual reviews, or client presentations where clarity is essential.
For just $0.99, you can download this editable slide, which works effortlessly in both PowerPoint and Google Slides. You’ll be able to customize dates and descriptions quickly to fit your specific story, making it ready to present in no time.
$0.99 – Purchase Checkout
Added to cart